
Are you searching for unique and captivating ways to present information? Infographics are an excellent choice! These visually appealing data visualizations are informative, grab attention, and make complex concepts easier to understand. If you’re looking to inspire your audience with creative infographic ideas, you’ve come to the right place. In this article, we’ll explore 20 innovative concepts that will help you craft compelling infographics.
5000+ Predesigned Infographic Templates from PhotoADKing
Choose a infographic template from a wide range of collections and customize it with ease.
Choose Infographic TemplatesGet ready to explore amazing ways to communicate your message effectively through visually stunning infographics. So, let’s dive in!
Table of Contents:
- Modern and Trendy Style Infographic
- Classic Style Infographic
- Geometric Shapes Infographic
- Steps Infographic
- Table Infographics
- Chart Infographics
- Charity Infographic
- Dark Theme Infographic
- Business Infographics
- Food Infographics
- Health Infographics
- Fashion Infographics
- Education Infographics
- Timeline Infographic
- Comparison Infographics
- Statistical Infographic
- Travel Infographic
- Product or Service Information Infographic
- Research Finding Infographic
- Social Media Infographic
20 Creative Infographic Ideas
Discover a wealth of inspiration with our curated list of 20 creative infographic ideas. Unleash your creativity and explore innovative approaches to conveying information visually. From sleek and minimalistic designs to eye-catching illustrations, these ideas for infographics encompass a wide range of styles to elevate your visual storytelling. Explore the endless possibilities and transform your data into engaging and compelling visuals with these creative infographic ideas.
Modern and Trendy Style Infographic
When you want to make a cool and modern infographic, there are lots of fun ideas. Let’s begin by designing one that shows off the newest fashion trends. Use cool pictures and writing that really capture what’s in style right now.
Then you can also try making your design look clean and simple. Use straight lines and give it a modern vibe by leaving some empty space. Add cool icons and drawings to make it interesting.
With these tips, you will definitely make your next infographic in a modern and trendy style.
Classic Style Infographic
If you like classic themes, then you should go with classic-style infographic ideas. Start by choosing a refined color palette, such as muted tones or shades of black and white, to create a sophisticated look.
Another idea is to use elegant typography, such as serif fonts, to give your infographic a refined look.
Lastly, consider using vintage icons or illustrations to represent data or concepts, adding a charming and timeless feel to your infographic.
With these classic-style ideas, you can create visually captivating infographics that engage and inform your audience delightfully.
Geometric Shapes Infographic
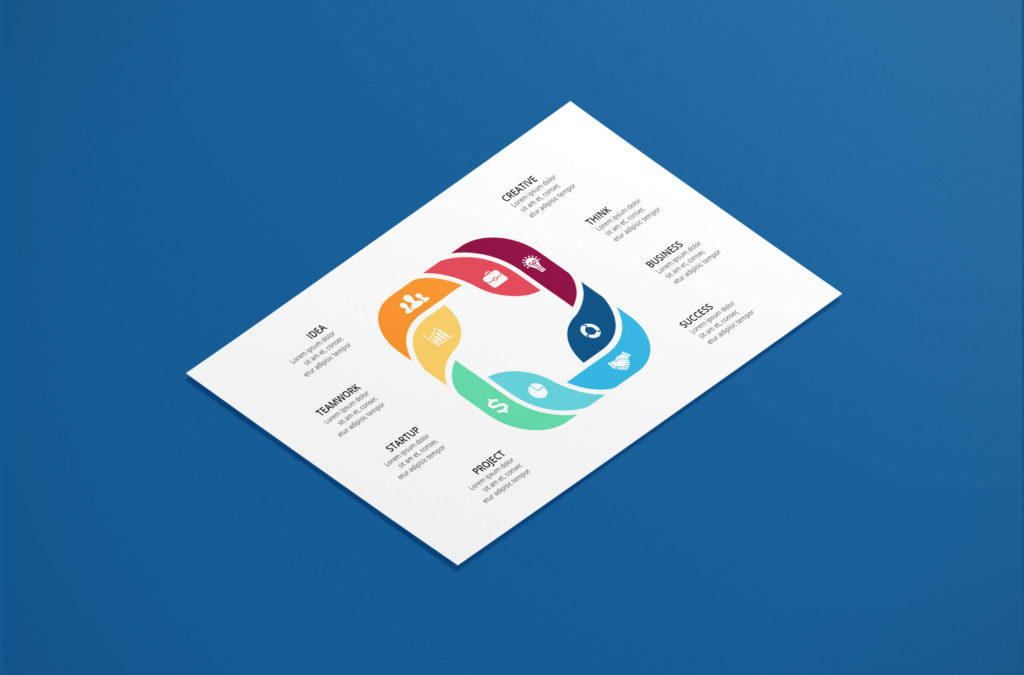
If you want to play with shapes and patterns, geometric shape infographics are a great choice. You can use triangles, circles, squares, or any other shape to create unique designs.
This style is especially useful when you want to showcase data that involves percentages or numerical values.
Some ideas for using geometric shapes in infographics include using circles or spheres to represent percentages or proportions and using triangles or diamonds for hierarchical information.
By combining different shapes and colors, you can create a unique and visually appealing infographic that effectively communicates your message to your audience.
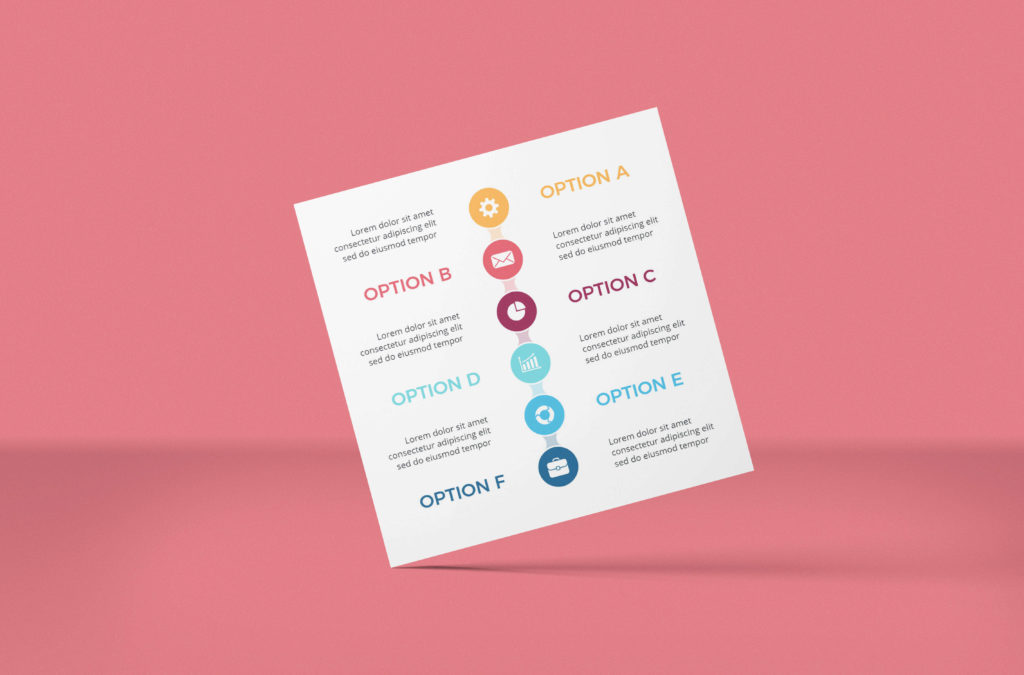
Steps Infographic
One idea is to break down a process into its individual steps and use icons or images to represent each step. This can make the infographic more engaging and easier to follow than if it were just a list of text-based steps.
You can also use color coding or numbering to help readers navigate the different steps. You can use different numbers of steps in infographics, for example, 4-step infographics, 3-step infographics, 5-step infographics, 6-step infographics, 7-step infographics, or 8-step infographics.
Another approach is to use a flowchart or diagram to illustrate the steps in a process. This can be particularly useful if the steps are interdependent and have branching paths. I think the steps infographics are perfect for you or any other business because people will consider your message when they see it in steps and in a perfect manner.
Table Infographics
Infographics are a great way to communicate complex information in a visually appealing format. When it comes to presenting data in tabular form, infographics can be particularly useful. Here are some table infographic ideas that you can consider:
Comparison tables: These tables are designed to highlight the differences between two or more items. They can be used to compare features of products or services, pricing plans, or any other types of data.
Timeline tables: These tables can be used to show the sequence of events over time. They are ideal for showcasing historical data, project timelines, or even personal milestones.
Statistical tables: These tables are perfect for presenting numerical data in an organized and easy-to-understand format. They can be used to present survey results, market research data, or any other type of statistical data.
Process tables: These tables can be used to illustrate the steps involved in a particular process. They are ideal for explaining complex procedures or workflows in a step-by-step manner.
No matter what type of table infographic you choose to create, it’s important to keep your audience in mind and make sure that your data is presented in a way that is both visually appealing and easy to understand.
Chart Infographics
When designing a chart infographic, it’s important to choose the right type of chart that best represents your data. Whether it’s a bar chart, line graph, pie chart, or any other type, each chart has its own unique strengths in displaying different kinds of information. Use a graph maker tool to easily create and customize your charts.
In addition to selecting the appropriate chart type, you should also pay attention to the overall design of your infographic.
Use colors, fonts, and illustrations that are consistent with your brand or topic. Keep the layout clean and uncluttered, making sure to label your axes and provide a clear title for your chart.
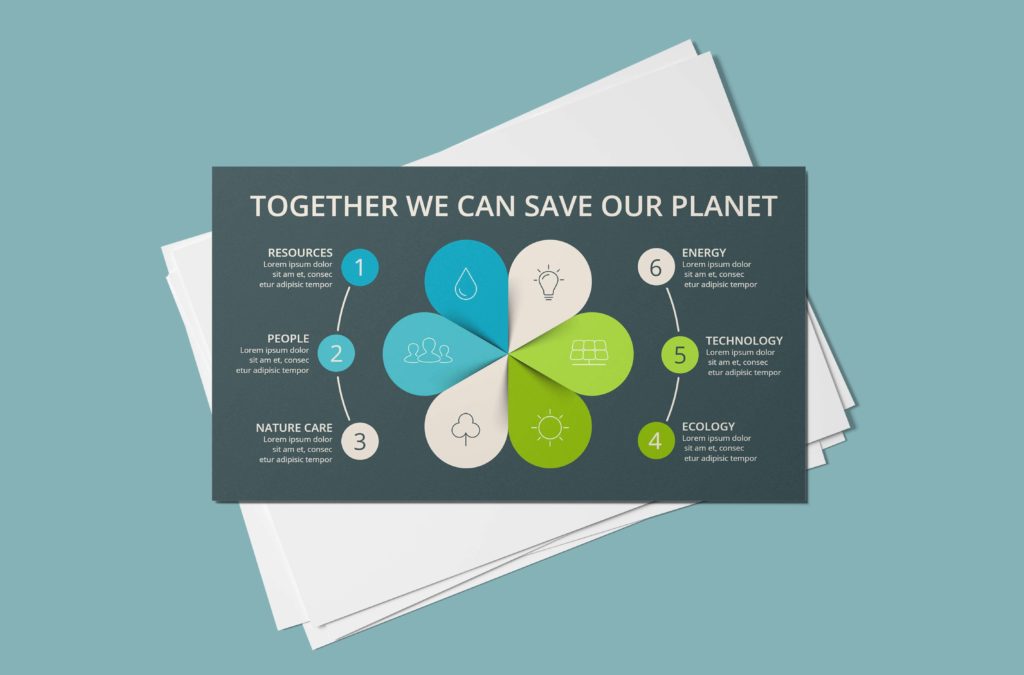
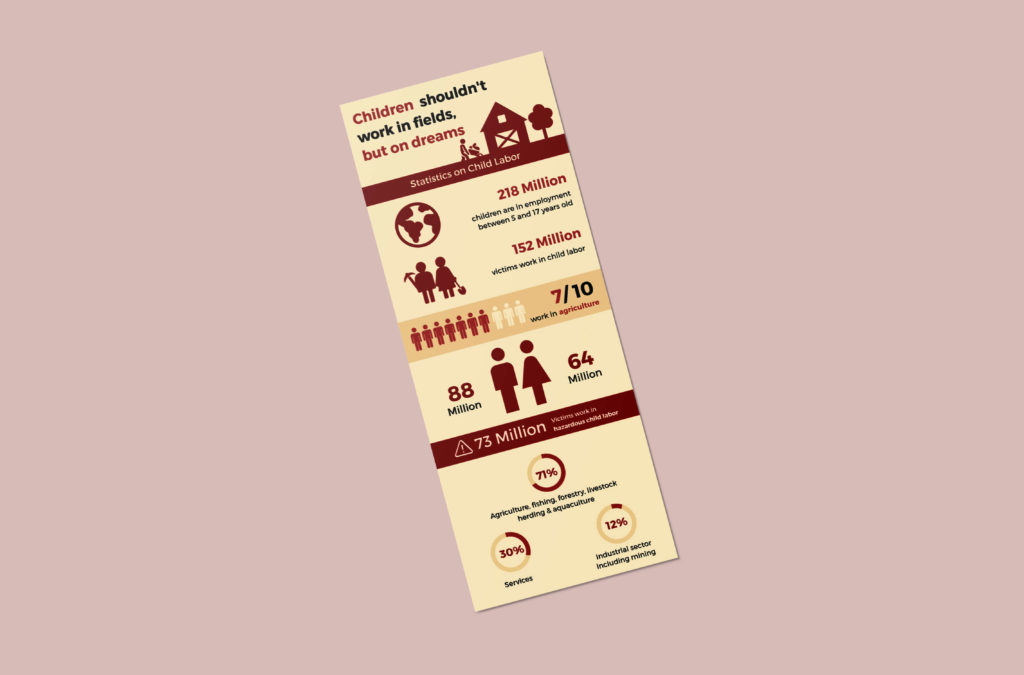
Charity Infographic
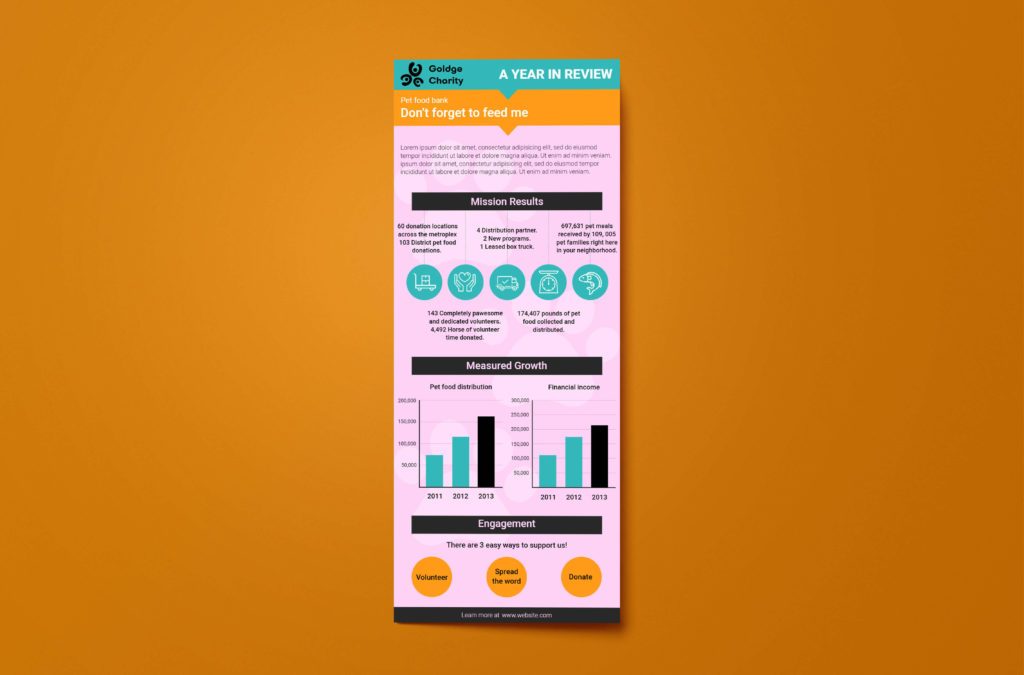
When it comes to charity work, conveying the impact of a cause is crucial for raising awareness and encouraging support. However, presenting raw data alone might not capture the attention or convey the message effectively.
This is where the use of creative infographic ideas becomes invaluable. By utilizing a combination of text, visuals, and design elements, infographics can transform complex data into a visually appealing and easy-to-understand format.
Infographic Ideas With Dark Theme
Many different infographic ideas work well with a dark theme. For example, you could create an infographic about the benefits of using renewable energy sources with a black background punctuated by bright green accents.
Other ideas might include a dark themed infographic explaining the science of climate change with a dark red or orange backdrop to convey the urgency of the issue.
Whatever topic you choose, there are plenty of ways to make a dark-theme infographic pop. By using bold fonts, contrasting colors, and eye-catching graphics, you can create an infographic that’s both informative and visually stunning.
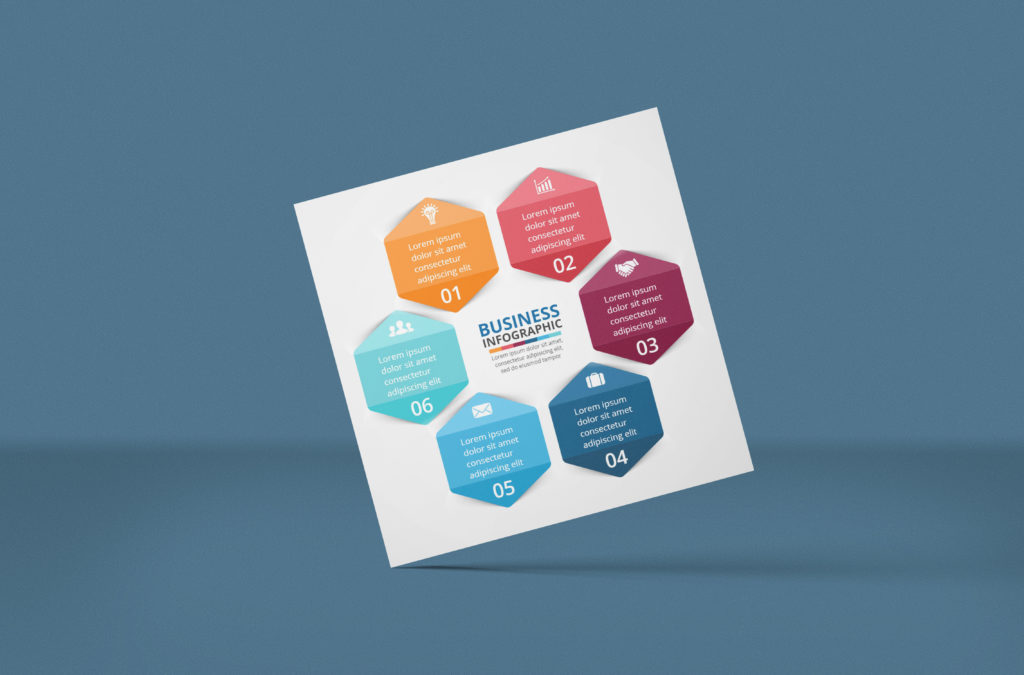
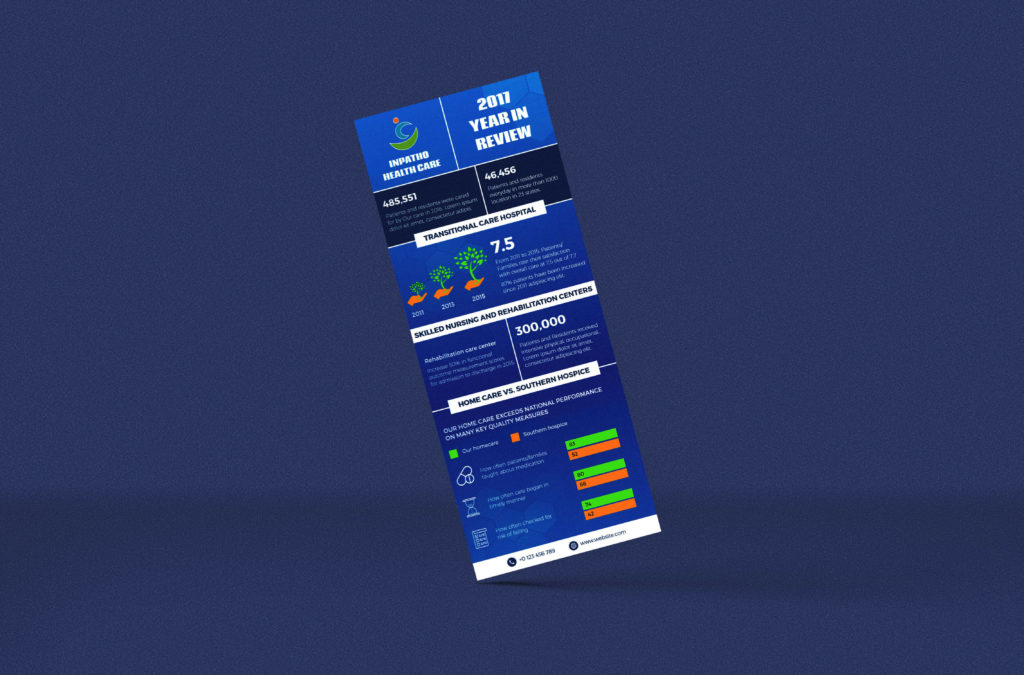
Business Infographics
For businesses, infographics can be a powerful tool for communicating complex ideas or data simply and straightforwardly.
This infographic makes it more concise and engaging. Business is guided by insightful analysis and statistics. In such times, due to time constraints, businessmen effectively use infographics to know more at ease.
As an example, a business infographic is made up of colorful pictures, dates, numbers, and graphics. Using a unique alphabet and font to understand these instructions, business-critical information is specially displayed.
Food Infographics
Food is another popular topic for infographics. From nutrition facts to recipes, there are endless possibilities for creating informative and visually appealing food infographics.
Food infographics make information easy to understand and digest as they break down complex data into simple and visually appealing formats.
Whether you’re a food blogger, nutritionist, or just someone who loves to cook and eat, infographics can be an excellent tool for sharing information about food that is both educational and engaging. So why not start exploring the world of food infographics today?
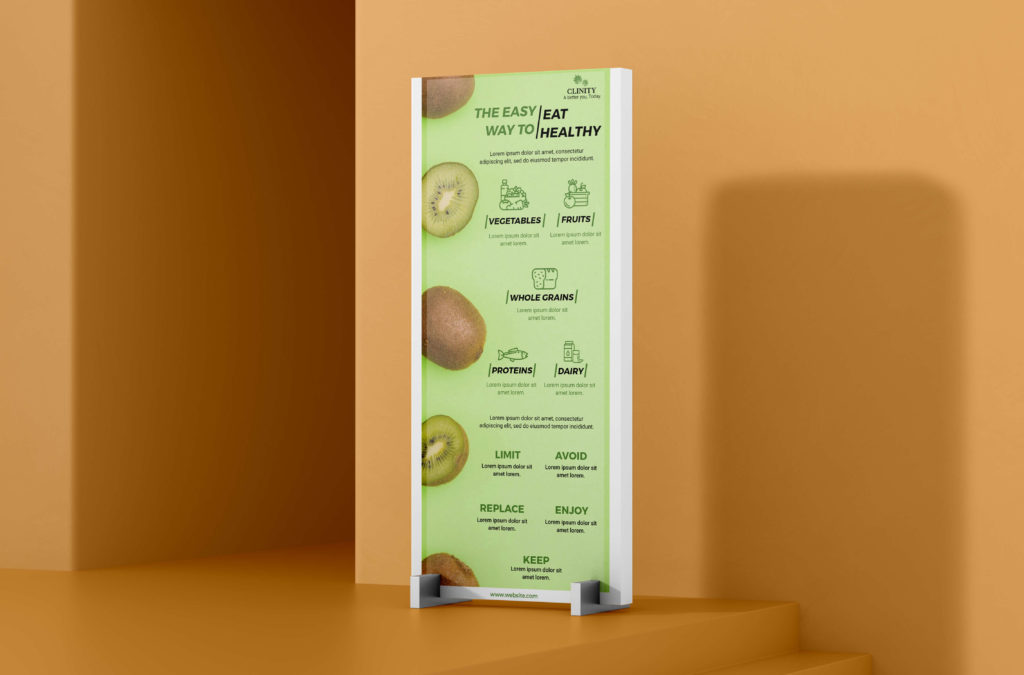
Health Infographics
Health is another area where infographics can be particularly effective. Whether you’re discussing the latest health trends or providing tips for healthy living, infographics can help convey important information engagingly and memorably.
Visualize the key steps people can take to prevent common diseases such as heart disease, diabetes, or cancer. But how can you start? By using simple language, clear visuals, and engaging design elements, you can create informative health infographics that effectively communicate important health messages to your audience.
Fashion Infographics
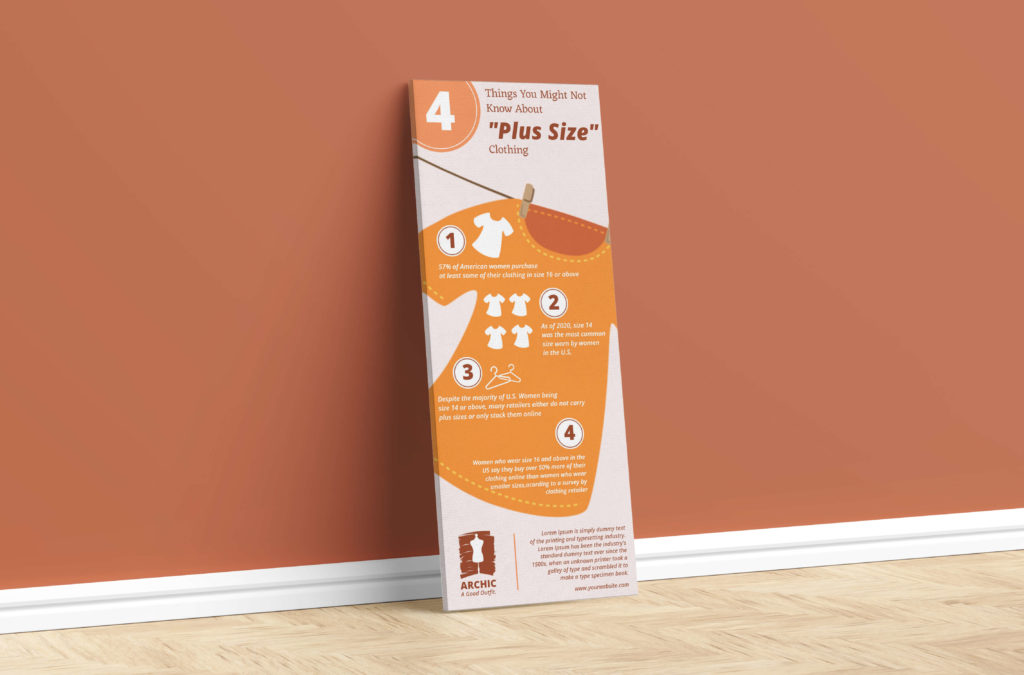
Fashion infographics are a great way to showcase the latest trends and styles. From outfit inspiration to beauty tips, a well-designed fashion infographic can capture the attention of any fashion enthusiast.
With some creativity and a little bit of research, you can create a compelling fashion infographic design that will inform and engage your audience. Nowadays, you know that in every little thing, the trend is important, so you can easily explore your business with fashion infographics.
Education Infographics
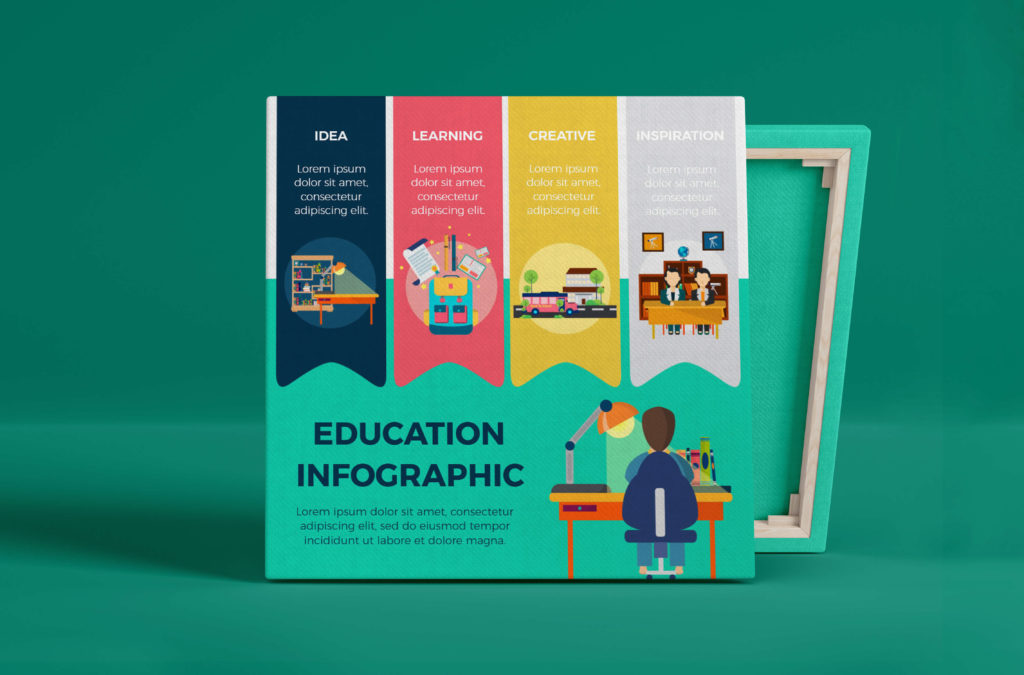
Education is a vast field, and there are many topics that you can turn into captivating infographics. Some ideas include visualizing global education statistics, comparing different educational systems, exploring the history of education, or diving into the impact of technology on education.
With these ideas as a starting point, you’re well on your way to creating compelling education infographics that will engage and inform your audience.
Timeline Infographic
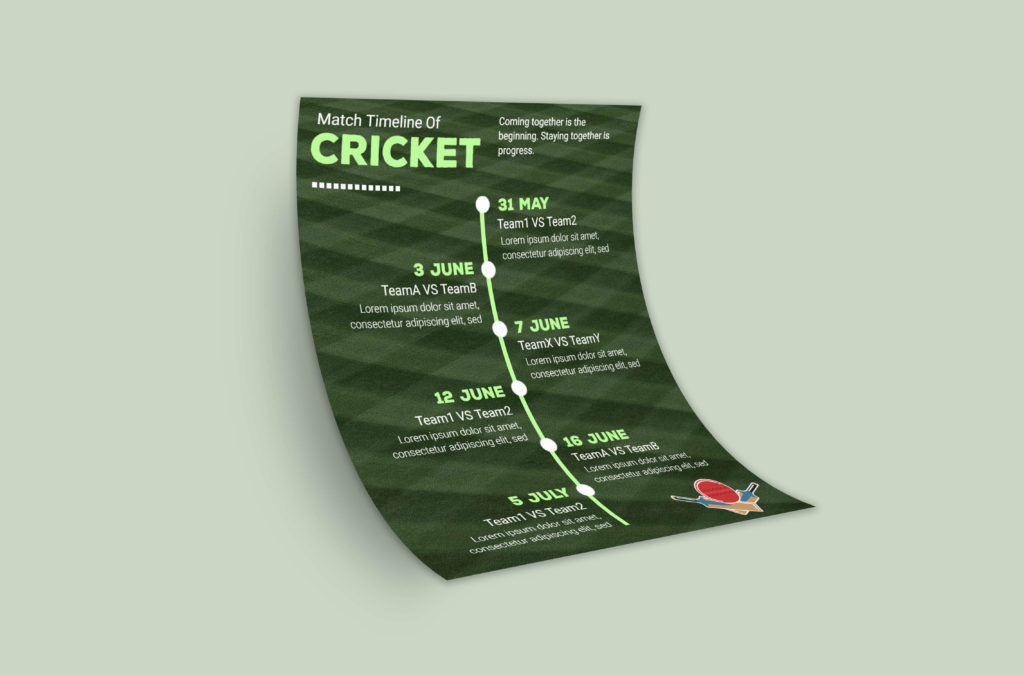
Timeline infographics are an excellent way to present information in chronological order. When it comes to creating timeline infographics, the first thing you should consider is the infographic topic.
Timelines make it easy to see how things have progressed over time and provide context for the current situation. So if you understand your point easily to your targeted audience, then you can go with timeline infographics.
In the process of designing a timeline infographic, color, layout, background, and format are all important, so be sure you consider all things.
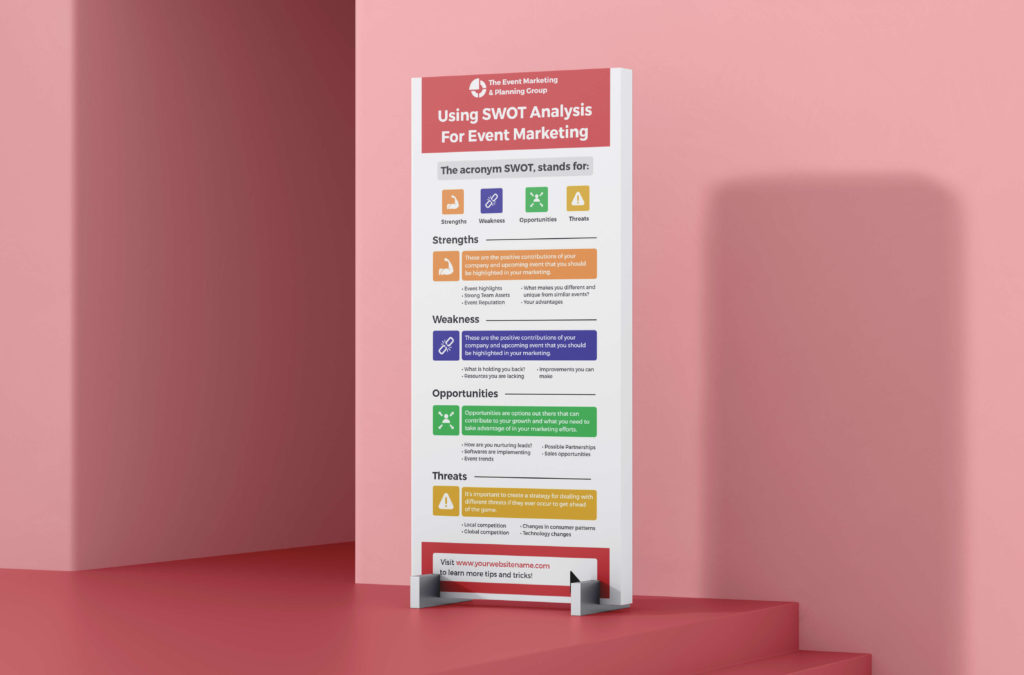
Comparison Infographics
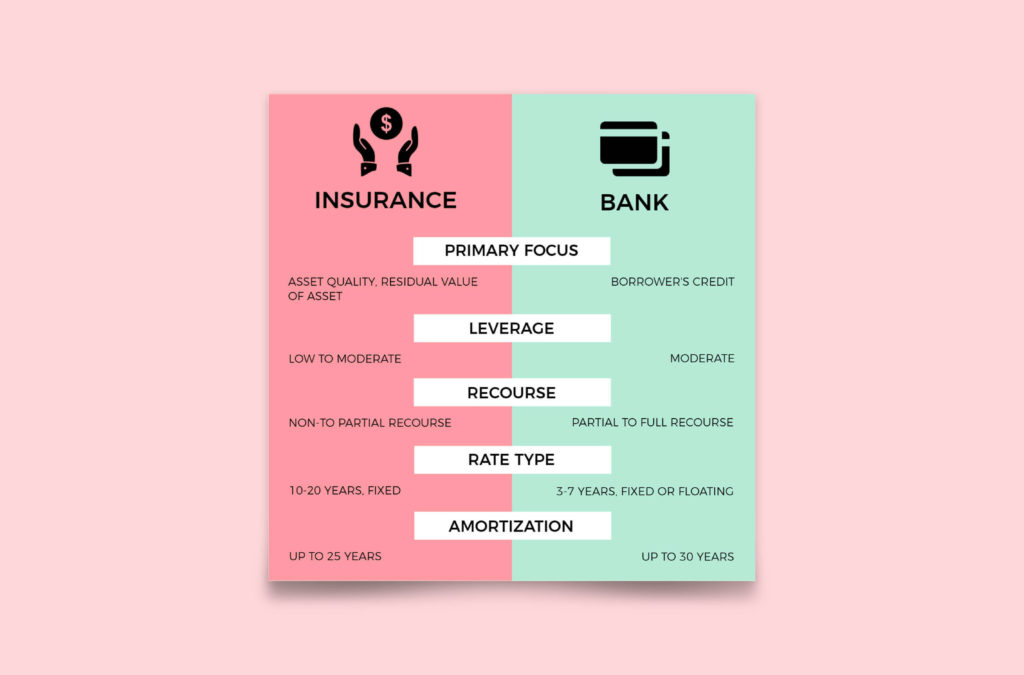
Comparison infographics allow you to showcase the differences between two or more things. For example, you could compare the benefits of two different products or compare the pros and cons of living in different cities.
If you want to show two years of business performance, then you should go with a comparison infographic idea. But when you design your infographic, be sure to go with a simple theme, as shown below the template. Because a more complex design and format can harm your business.
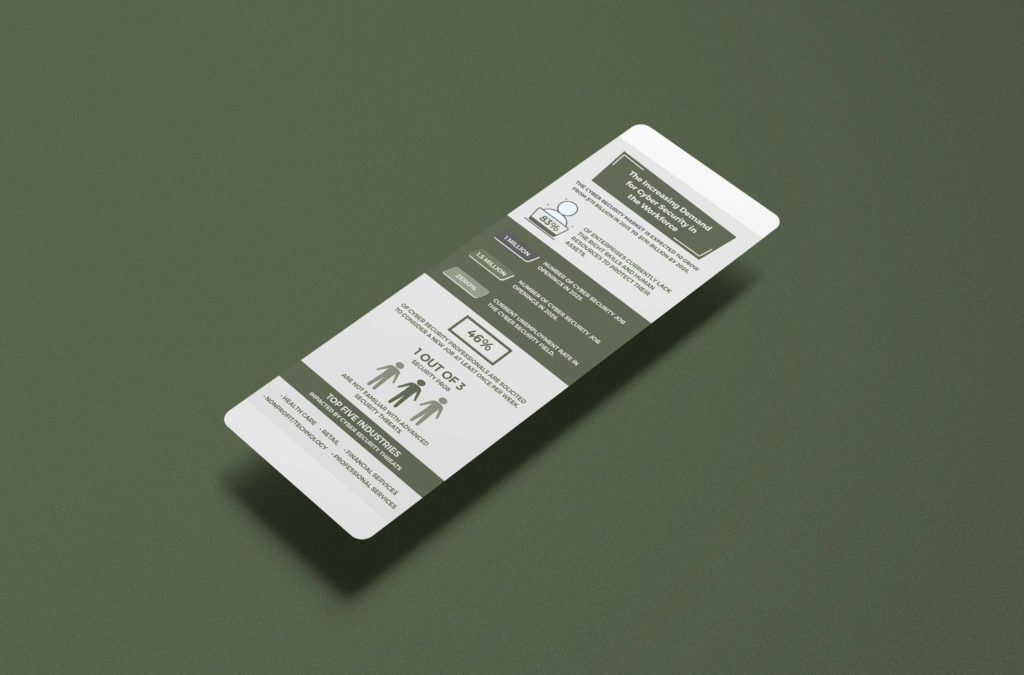
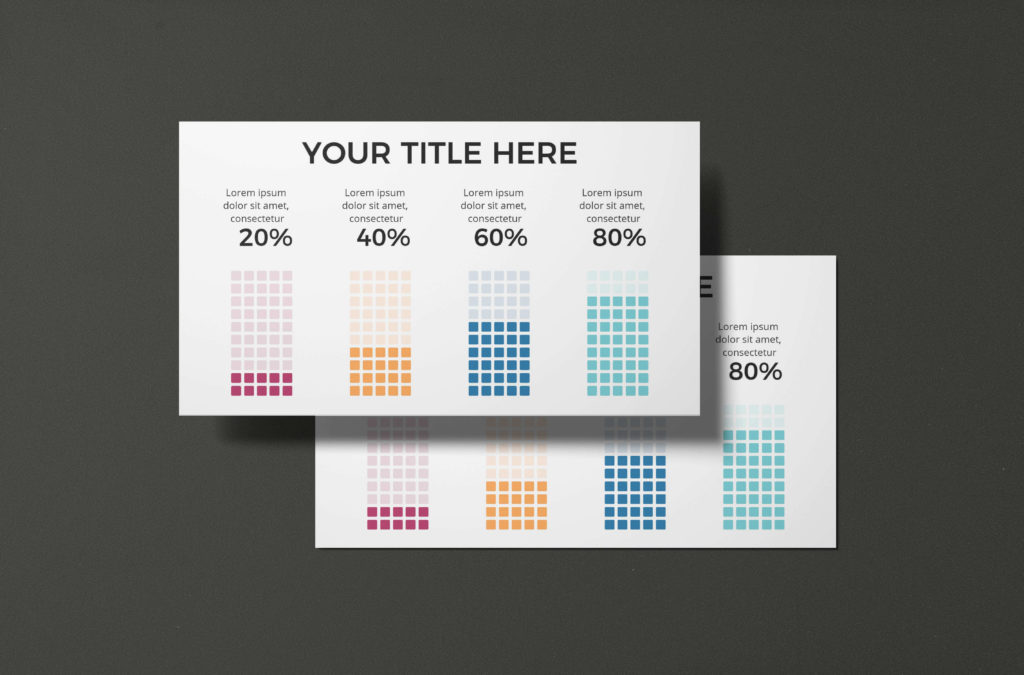
Statistical Infographic
Infographics can be a great way to share statistical data. You can use them to break down complex data into easy-to-understand visuals or to highlight the key trends in your data.
Sometimes for common people who don’t have a better understanding of statistics. Then, at this time, if any business or country wants to understand their point only you can go with statistical infographics.
This type of infographic is all about presenting statistical data in a clear and easy-to-understand way. You could use charts, graphs, and other visual aids to show trends, patterns, and correlations in your data.
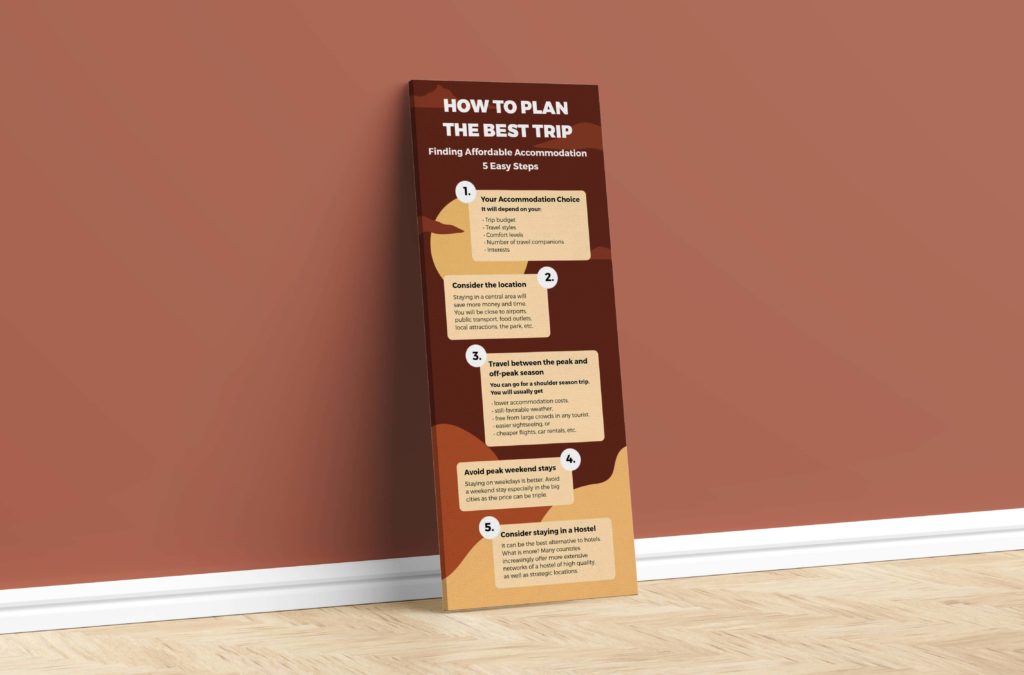
Travel Infographic
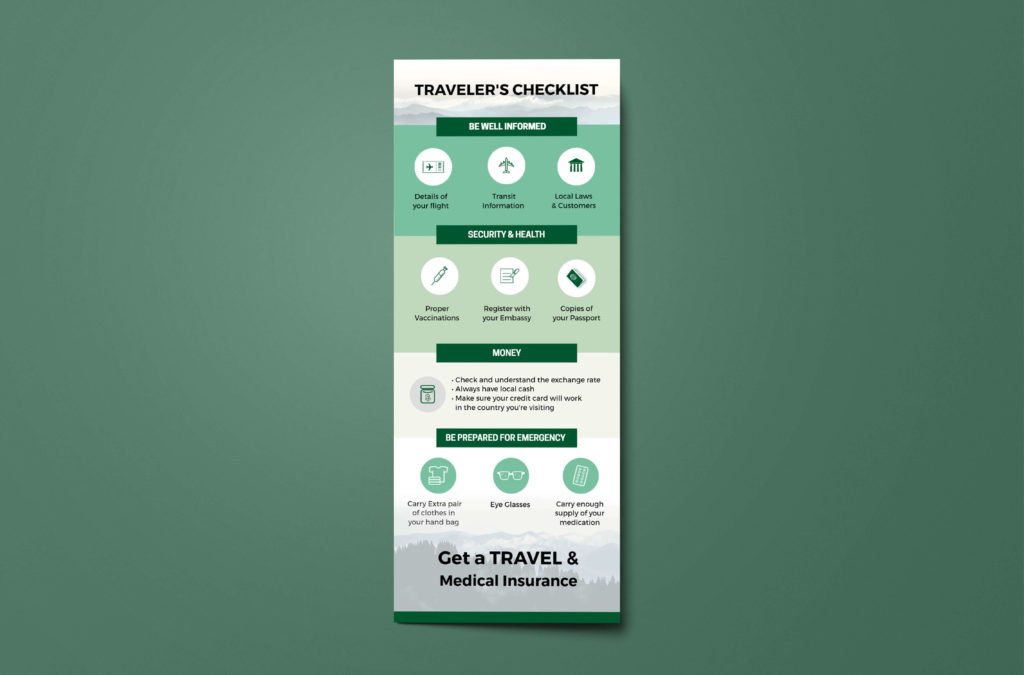
Infographics can be a great way to share travel information. You can use them to create a visual guide that will help your readers plan their trip or highlight the key attractions at a particular destination.
Most travelers don’t want to waste their time reading a long list of timing and other things. So choose infographics to easily understand your agency’s travel plans or trip timing.
Product or Service Information Infographic
Nowadays, everyone prefers online shopping because they don’t have time to go to the mall or any shop for shopping. So they are looking for something that easily explains what the products are. With a well-designed product infographic, you can easily attract people to come to your website and purchase your product.
Remember, the key to creating an effective infographic is to keep it simple, clear, and visually engaging. By presenting your product or service information in a way that is easy to understand, you can capture the attention of potential customers and differentiate yourself from competitors.
Research Findings Infographic

One of the most effective ways to present research findings is by comparing data. You can create an infographic that compares data side-by-side to highlight differences and similarities.
If your research reveals trends or patterns over time, consider creating an infographic that charts that data. This can help your audience visualize the changes or shifts that have occurred over some time.
Depending on what you studied, making a map to show where you did your research and where you found things can be a good way to share your results. An infographic that displays this information visually can be a great way to show your data.
Social Media Infographics
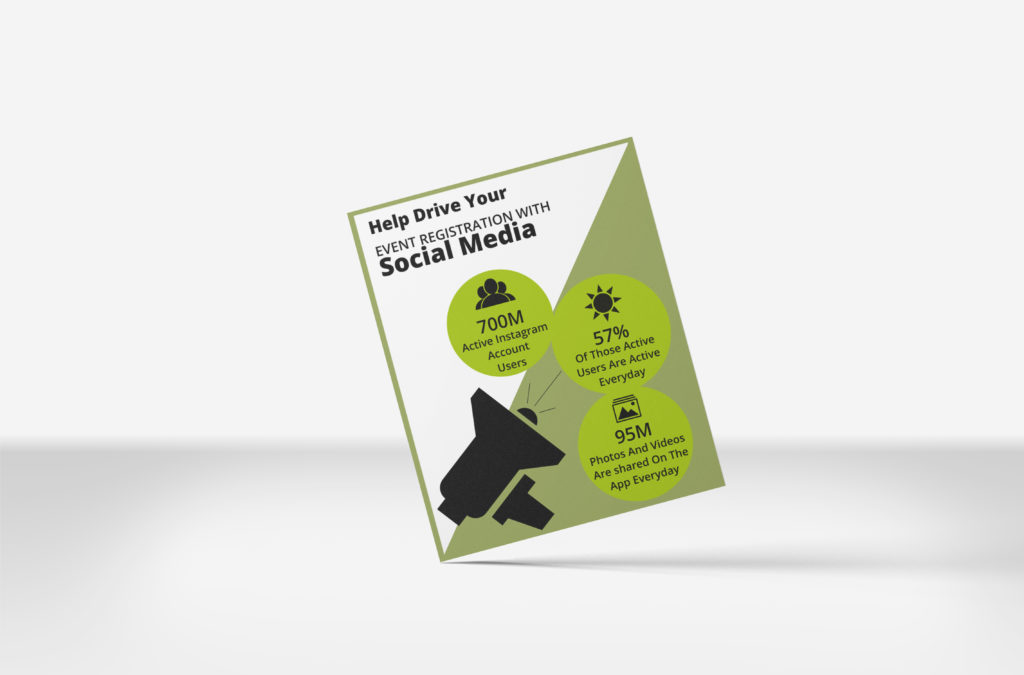
In today’s digital age, social media has become an important part of our daily lives. It’s not surprising that both businesses and people use social media to talk to their audiences and show off their brands. Infographics are a cool way to share important ideas and plans about social media in a fun and interesting way.
Create an infographic that illustrates the demographics of different social media platforms, including age, gender, and location data. When you are working on branding for your business, you should consider ways infographics can help improve brand visibility.
Remember, the most effective social media infographics are those that are visually appealing, easy to read, and packed with useful information.
So, now you have clear ideas about your next infographic design. Furthermore, we will learn creative infographic design tips that can help you create infographic designs effectively.
Creative Infographic Design Tips
Explore the art of creative infographic design with our invaluable tips. Whether you’re a seasoned designer or seeking inspiration for infographic design ideas, this guide covers key elements such as color schemes, typography, and layout considerations. Unleash your creativity and transform data into compelling visual stories with our concise and insightful tips on infographic design.
Start with a clear message: Before you begin designing your infographic, it’s important to have a clear idea of what you want to communicate and the key message you want to convey.
Keep it simple: Infographics should be easy to read and understand. Avoid cluttering your design with too much information or unnecessary elements.
Choose the right colors: Selecting the right color scheme can make a big difference in the effectiveness of your infographic. Use colors that complement each other, are visually appealing, and help convey your message.
Use visuals: Infographics are all about visual communication, so be sure to include relevant and eye-catching graphics, icons, or images to support your message.
Make it shareable: Create infographic ideas that people will want to share on social media platforms. Ensure that they are formatted correctly for different platforms and include a link back to your website or brand.
Use data effectively: infographics often rely on data to tell a story, so make sure that your data is accurate and presented engagingly. Use charts, graphs, or diagrams to help visualize complex data sets.
Make it scannable: People tend to scan content online, so make sure your infographic is designed to be easily skimmed. Use headings, subheadings, and bullet points to break up text and make it easier to digest.
Test and iterate: Once you’ve created your infographic, test it out with a small group of people to get feedback. Use this feedback to refine your design and make improvements where necessary.
Conclusion
In a world overflowing with information, infographics provide a breath of fresh air by presenting complex ideas in a visually compelling and easily digestible format. By embracing creative infographic ideas like colorful data explosions, storytelling with icons, and interactive infographics, you can captivate your audience and deliver information that sticks.
So, go ahead and unleash your creativity to create infographics with our infographic maker that engages, informs, and leaves a lasting impression.
FAQs
Infographics are a powerful tool in any marketing strategy for several reasons. Firstly, they are visually appealing and can quickly grab the attention of your audience. Secondly, they are an effective way to communicate complex information or data in a simple and easy-to-understand format. This makes them ideal for presenting statistics, research findings, or product information. Finally, infographics are highly shareable on social media platforms, increasing your brand’s exposure and potentially attracting new customers.
Yes, several online tools provide easy-to-use templates and drag-and-drop interfaces to create stunning infographics. One of the best infographic-making tools online is PhotoADKing. This provides you with pre-designed templates and allows you to customize them.
When organizing information in an infographic, start with a clear hierarchy and structure. Use headings, subheadings, and visual cues to guide readers. Break down complex concepts into bite-sized sections and ensure a logical flow from one point to another.
Absolutely! Interactive infographics are like online pictures that you can play with. You can click, scroll, or move your mouse over different parts to see cool things happen, like animations or information popping up. It’s a fun and engaging way to learn and explore!