
In today’s digitally-driven world, the use of eye-catching and informative infographics has become increasingly popular for conveying complex information in a visually appealing manner. However, with so many different types of infographics available, it can be challenging to know which one is right for your message.
The world of infographics consists of different types, each serving a specific purpose. From layout and industry to creative and interactive, there’s an infographic type for every need.
May you are looking for an easy way to create your infographic but are a little bit confused about how to start. Here you can easily make any type of infographic using PhotoADKing’s infographic maker. Creating a professional infographic is super easy with PhotoADKing’s infographic maker. Our intuitive interface gives you the power to unleash your creativity. Give it a try today!
Explore Stunning Infographic for Your Business
Create stunning infographics with PhotoADKing’s infographic maker. Boost engagement and impress your audience.
Explore Infographic Maker NowAlright, so now let’s move ahead. Here you will learn about different types of infographics and delve into their unique characteristics and applications. From classic statistical infographics to timeline infographics, comparison infographics, and more, we will also discuss how each type can effectively convey information and engage viewers.
Table Of Content:
- Layout Types of Infographics
- Steps Types of Infographics
- Industry Types of Infographics
- How to Choose the Right Infographics
- Conclusion
- FAQs
So, let’s dive into different types of infographics and discover the power of visual storytelling through these dynamic and versatile visual aids.
Layout Types of Infographics
There are several types of layouts that can be used in infographics to present information in a visually appealing and organized manner. Here are some common layout types of infographics you must check.
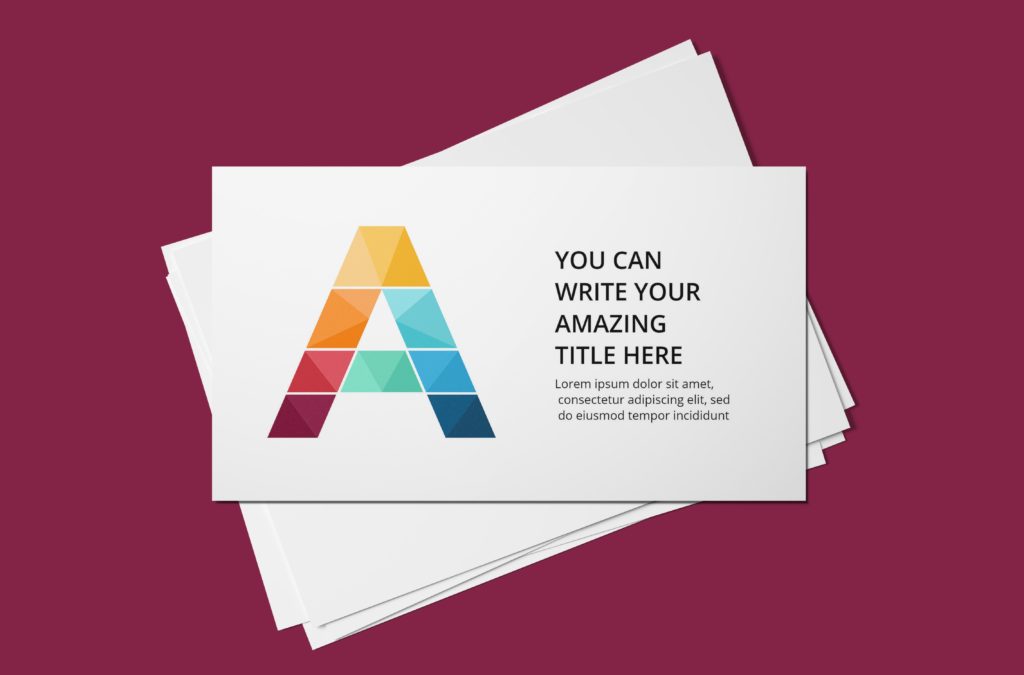
Alphabet Infographics
These infographics use letters of the alphabet to create visual representations of information. This type of infographic is great for presenting information in a fun and engaging way, particularly when targeting children or for educational purposes.
Alphabet infographics can also use to teach basic vocabulary, spelling, or grammar concepts or even to showcase interesting facts about a particular topic.
Line Infographics
Line infographics are a great way to present data in a visually appealing and easy-to-understand way. They can use to illustrate a wide variety of topics, from business trends to scientific data.
Line infographics typically made up of a series of lines that connect data points, and they can enhance with additional elements such as text, images, and icons.
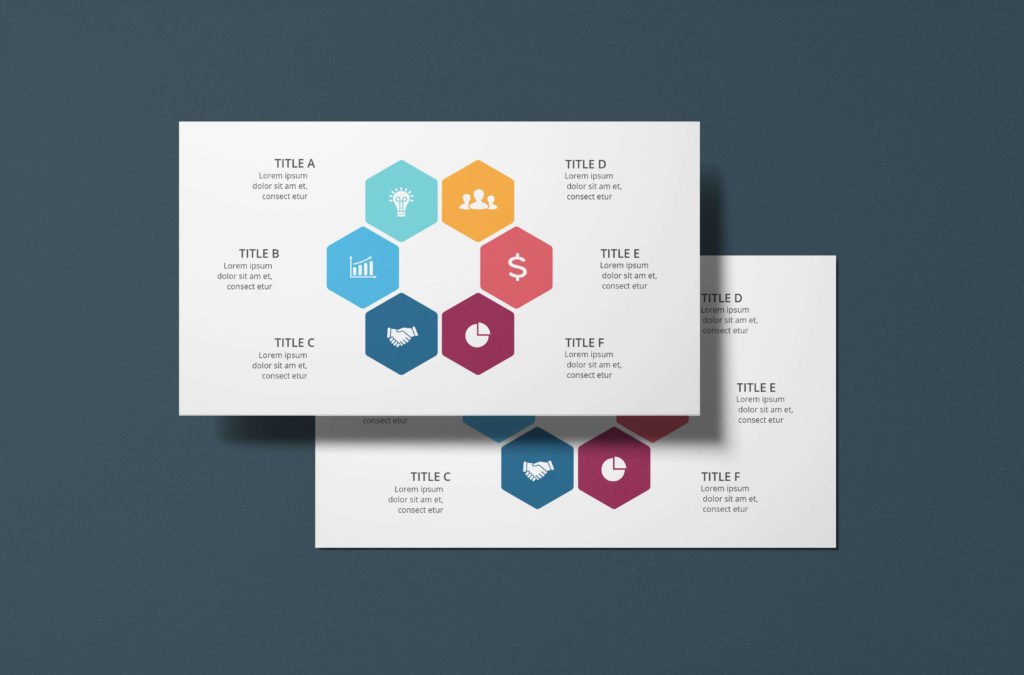
Geometric Infographics
Geometric infographics are a popular choice for marketers, designers, educators, and researchers as they offer a visually appealing way to represent different types of information.
By incorporating shapes such as circles, squares, and triangles, these infographics can effectively compare and contrast different sets of data by placing them side by side in an easy-to-understand format.
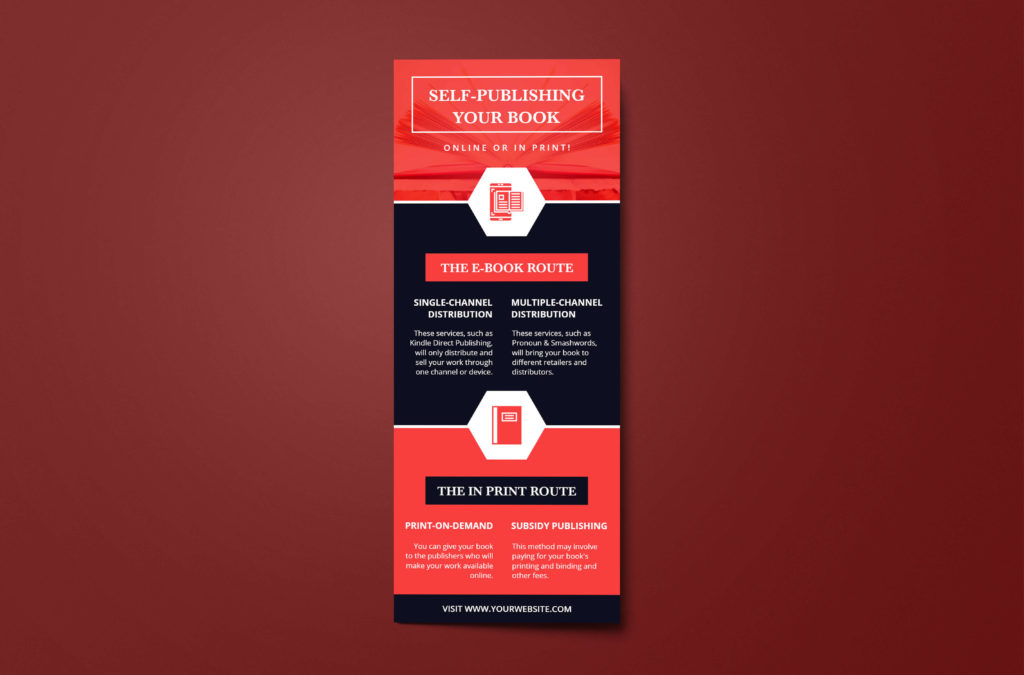
Dark Infographics
Dark infographics have become increasingly popular in recent years, with many marketers and social media users utilizing this style to make their content stand out. Additionally, the use of dark infographics can help convey a sense of sophistication and elegance, making them especially well-suited for luxury brands or high-end products.
Furthermore, the sharp contrast between the colors used in dark infographics can also make them easier to read.
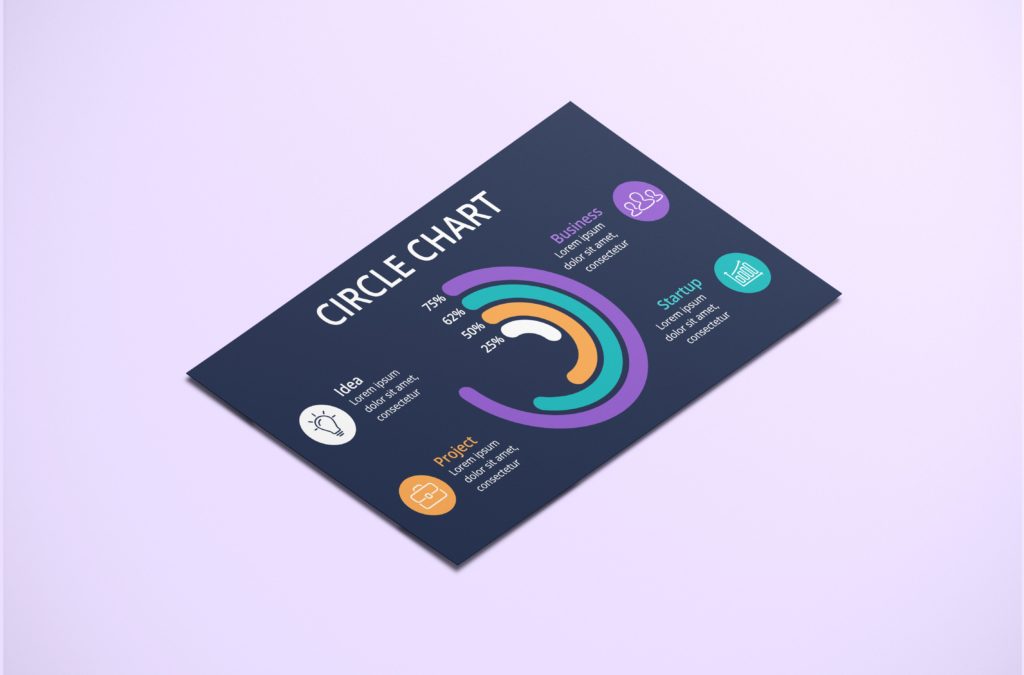
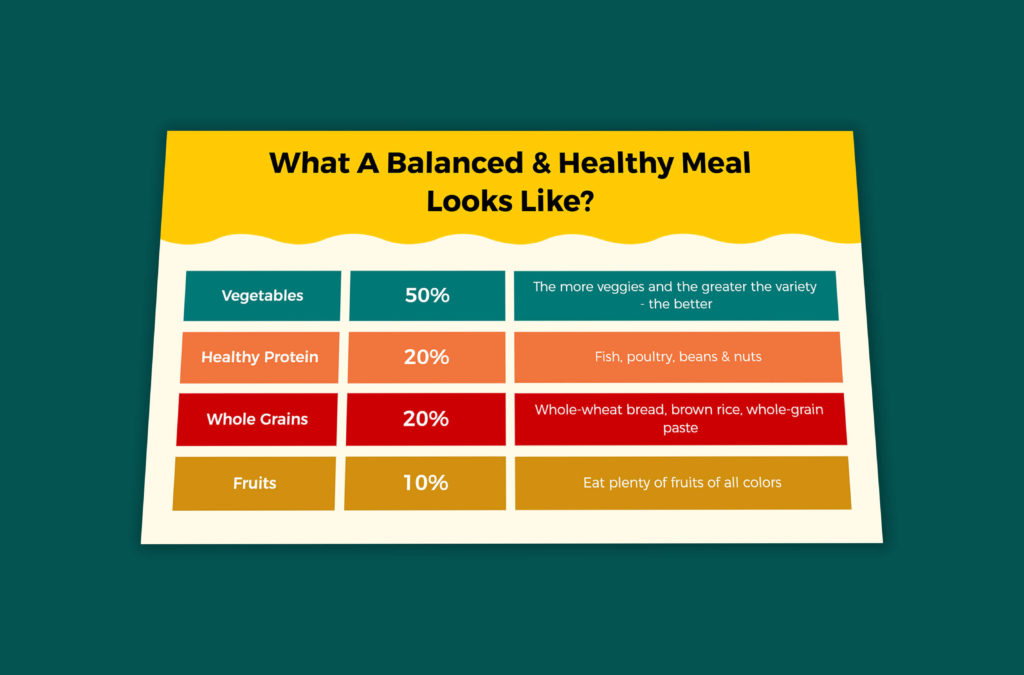
Table Infographics
Table infographics are another popular type of infographic that presents data in a tabular format. These infographics are also useful for comparing different sets of data or for displaying multiple data points in a single graphic.
Table infographics can be simple or complex depending on the amount of data being presented. They are particularly useful for business reports or financial statements.
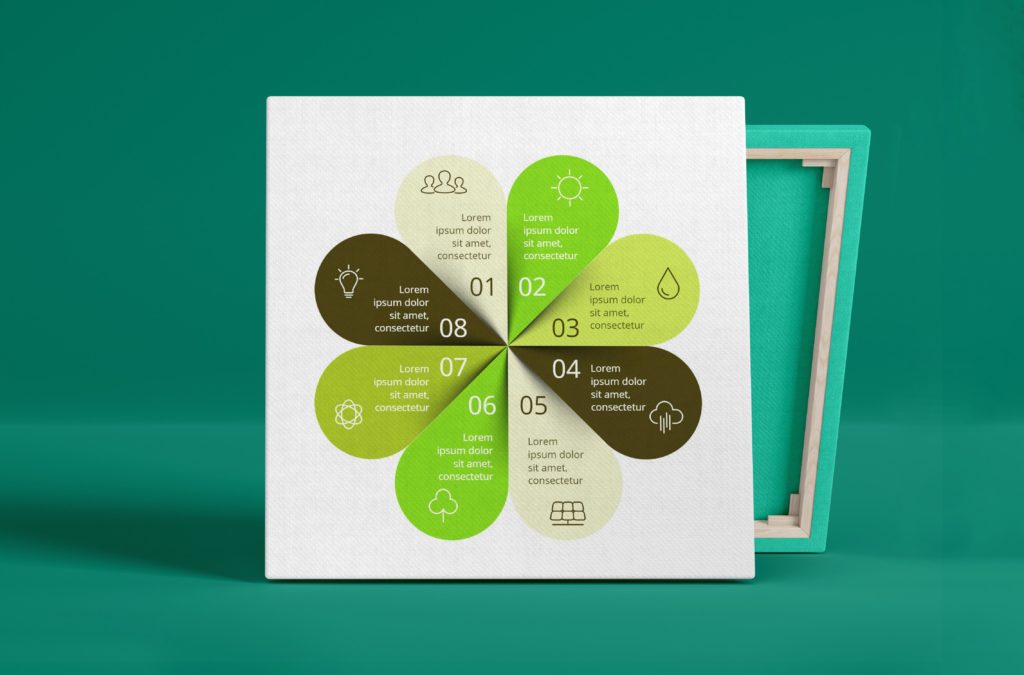
Circle Infographics
Circle infographics are a popular type of infographic that uses circular shapes to illustrate information. We recommend using infographics to display data divided into percentages or proportions, such as market share, demographics, or budget allocation.
Circle infographics also offer visual appeal, readability, and an excellent overview of the presented information.
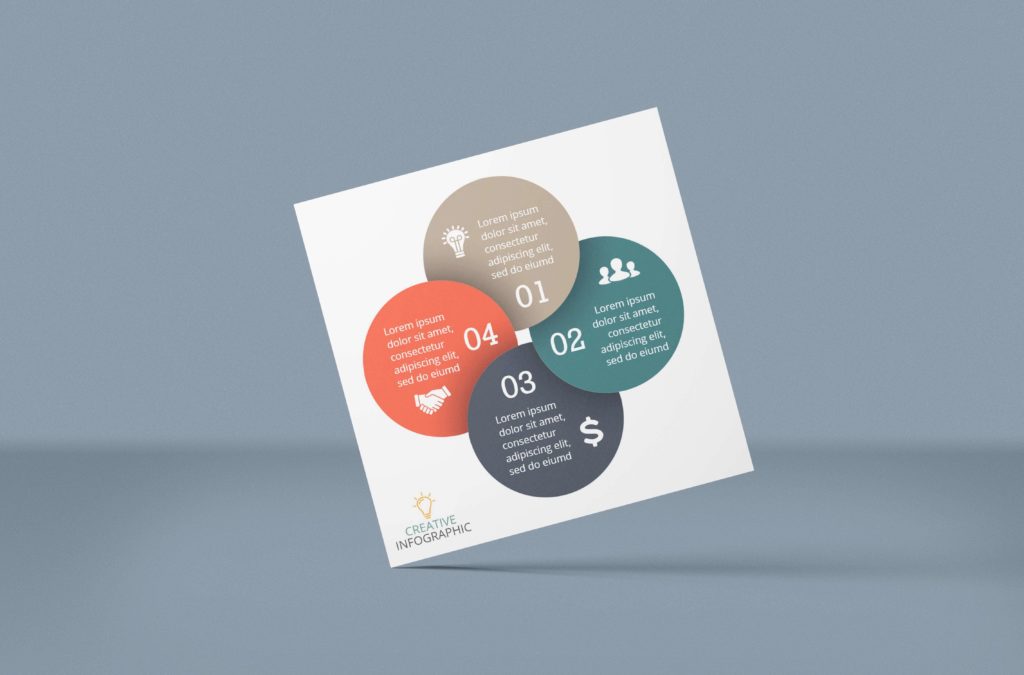
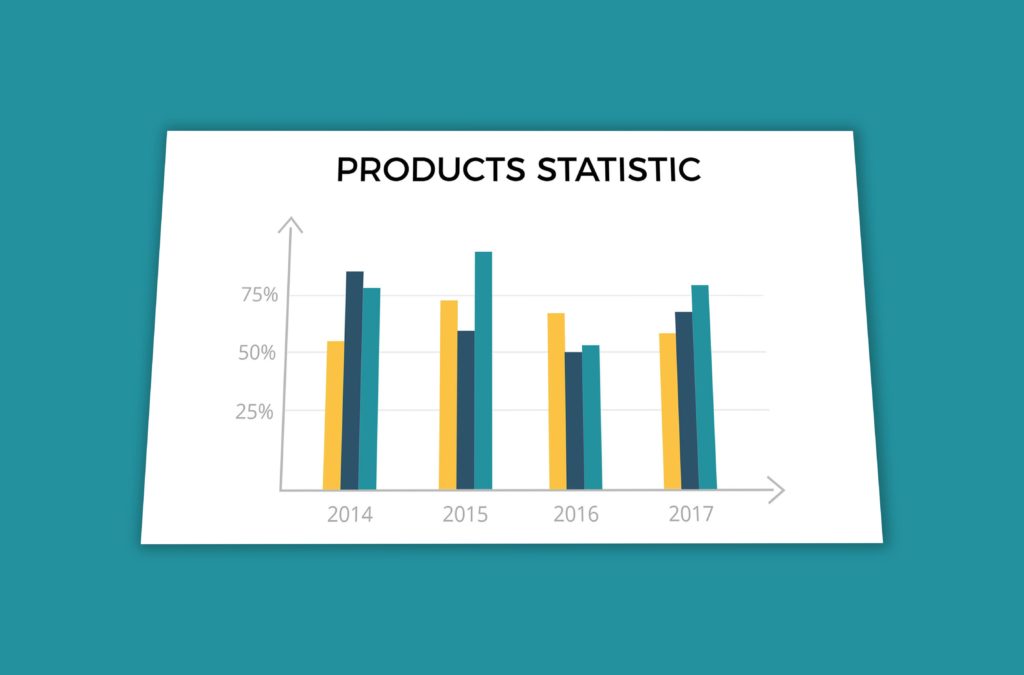
Chart Infographics
Chart infographics are a type of infographic that uses charts and graphs to visualize data. They are often used to present statistical information, such as sales figures, customer demographics, or product usage data.
Chart infographics can be very effective for communicating complex data in a way that is easy to understand.
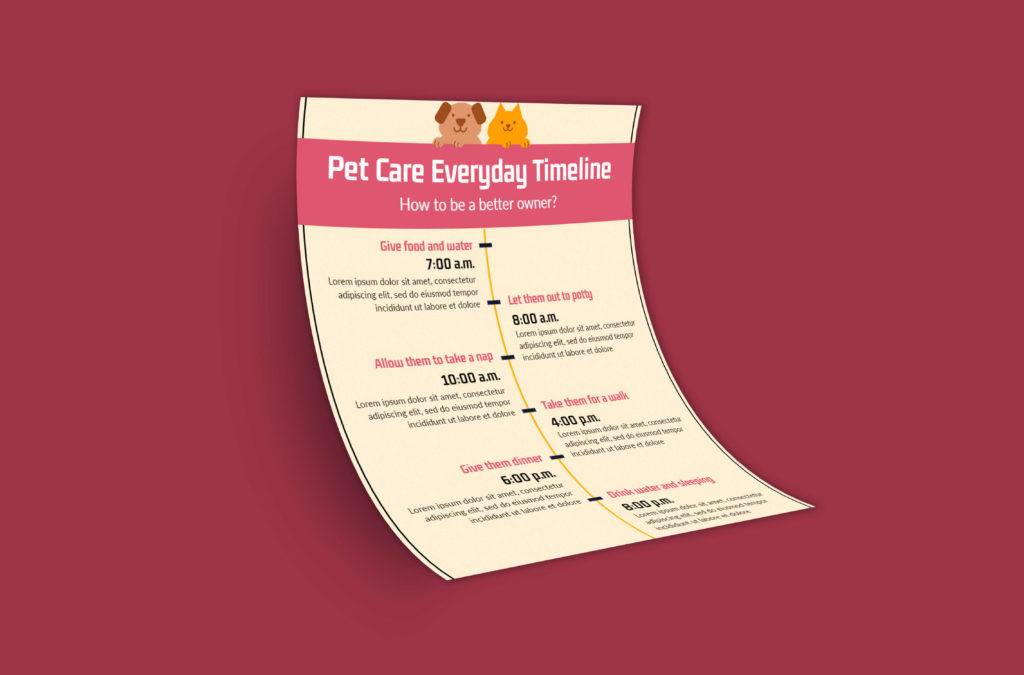
Timeline Infographic
These infographics are useful for telling a story over time, such as the history of a company or the evolution of a particular technology. Additionally, timeline infographics typically feature a chronological order of events, accompanied by images or icons that represent each milestone.
This type of infographic is also great for providing context and helping your audience understand the bigger picture.
Comparison Infographics
Comparison infographics are a powerful tool for highlighting differences between two or more things. They also include side-by-side comparisons of features, benefits, or other attributes of products, services, or ideas.
Additionally, comparison infographics are great for helping your audience make informed decisions by presenting all the relevant information in an easy-to-digest format.

Process Infographics
Process infographics are used to explain a particular process or procedure. They are often used in instructional materials, tutorials, and manuals.
These infographics typically use a step-by-step approach and include diagrams or illustrations to demonstrate each stage of the process.

Mindmap Infographics
Mindmap infographics are visual representations of ideas and concepts. They are often used for brainstorming, problem-solving, and planning. Moreover, mindmap infographics typically feature a central idea or theme with branches leading out to related subtopics and ideas.

Agenda Infographics
Agenda infographics are used to provide an overview of a meeting or event. They often include a timeline or schedule of events, as well as important information such as the location, time, and topic of discussion.
Additionally, agenda infographics are useful for keeping attendees informed and on track throughout the course of an event.

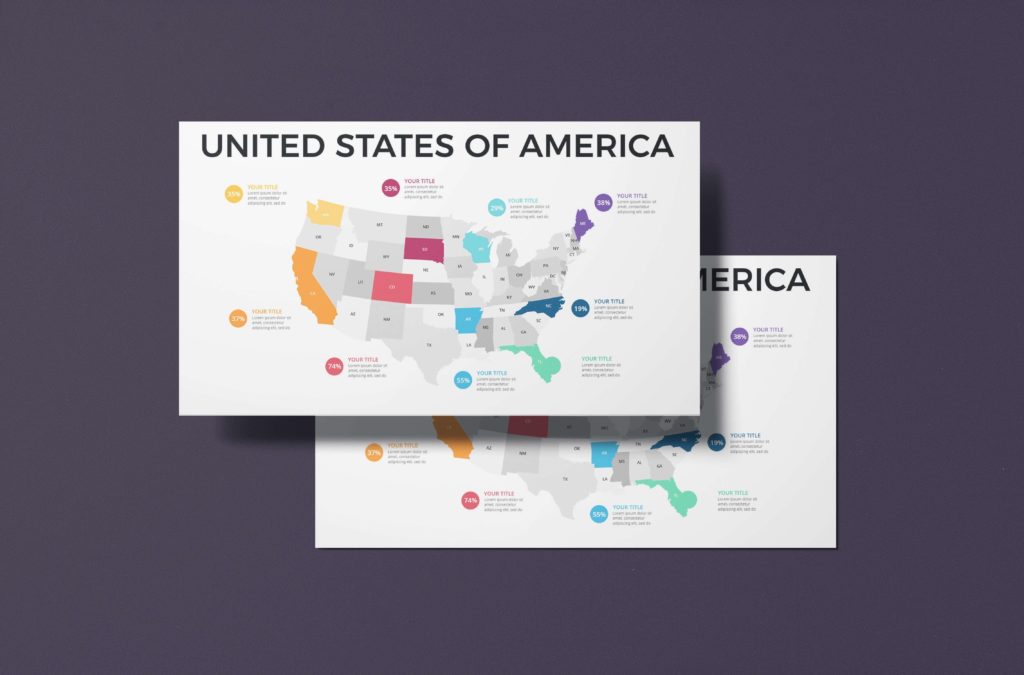
World Map Infographics
World Map Infographics offer a unique and visually captivating way to represent data related to global trends, demographics, or geographical information. By incorporating colorful maps, charts, and illustrations, World Map Infographics also present complex data sets in a comprehensive and accessible manner.
Whether you want to showcase population density, explore travel destinations, or analyze market trends across different countries, World Map Infographics provide your audience to grasp the information effortlessly.
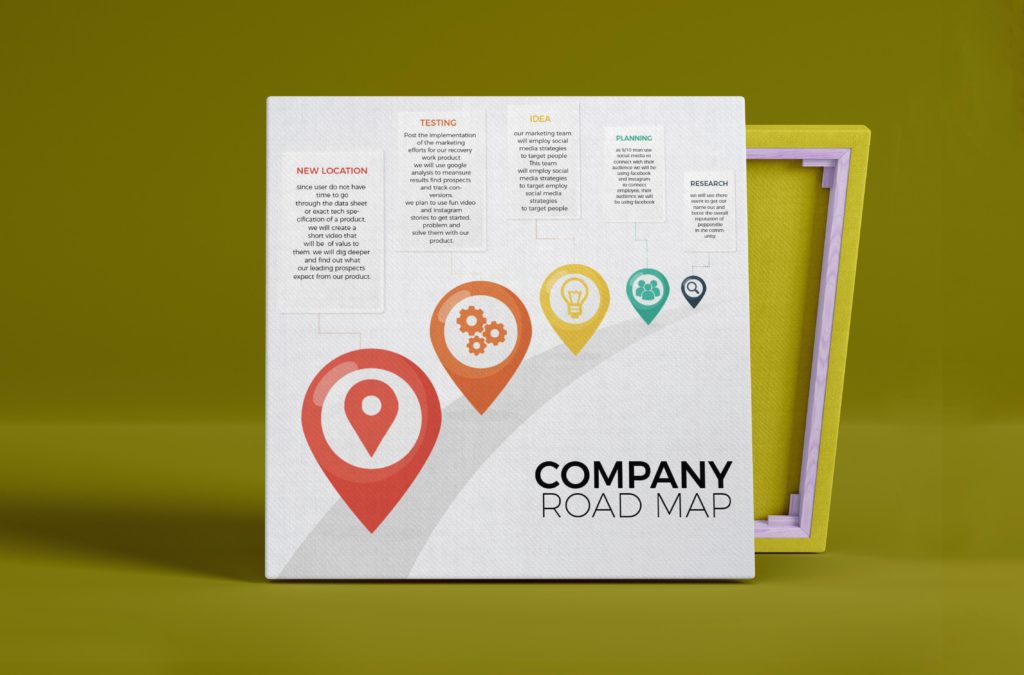
Road Map Infographics
Road map infographics are a type of infographic that is used to communicate information about a product or service. Furthermore, they can be used to show the features of a product, the benefits of a service, or the steps involved in using a product or service.
Overall, road map infographics can be a great way to educate potential customers about a product or service and to help them make a decision about whether or not to purchase it.
So now you have got perfect ideas about layout infographic types. Let’s move on to the steps types of infographics.
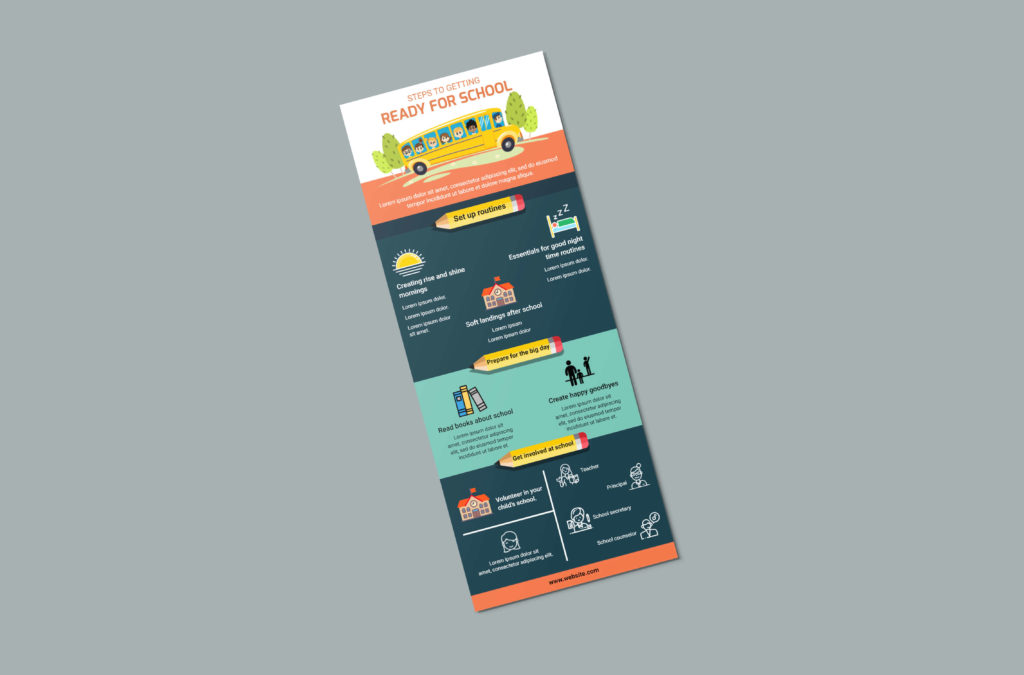
Steps Types of Infographics
If we go a little further, you can see the steps types infographic here. If you want to understand your business plans or process in steps, then these infographics are useful for you.
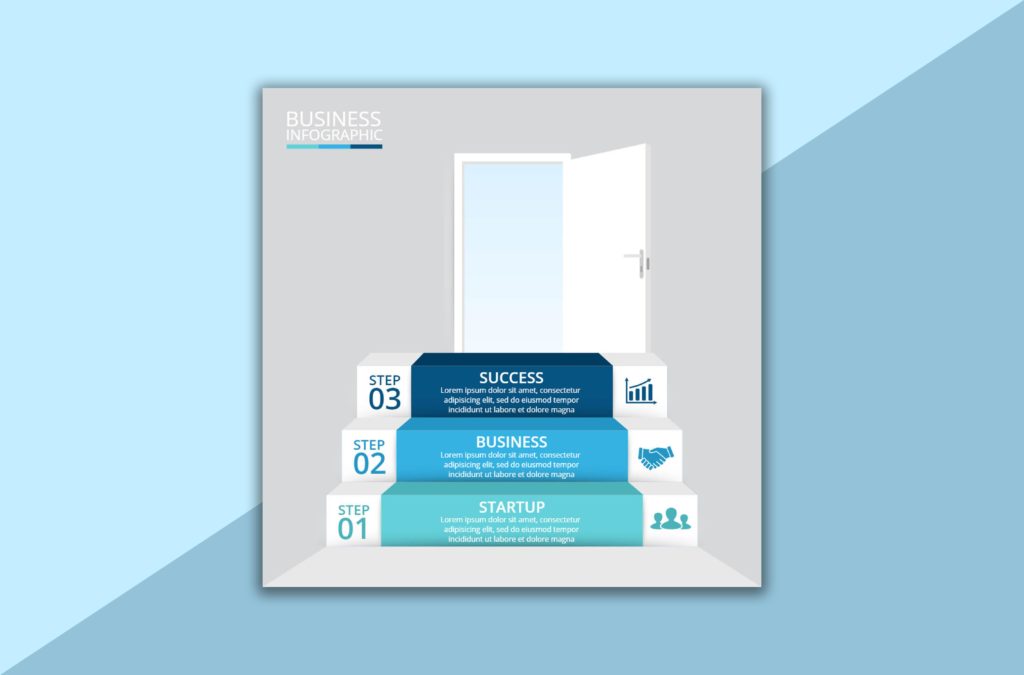
3 Step Infographics
When it comes to presenting processes or step-by-step instructions, 3 Step Infographics are a powerful tool. They simplify complex procedures into a concise and visually appealing format, ensuring that your audience can easily follow along.
Whether you want to explain a cooking recipe, a DIY project, or a scientific process, 3 Step Infographics break down the information into three clear and digestible steps.
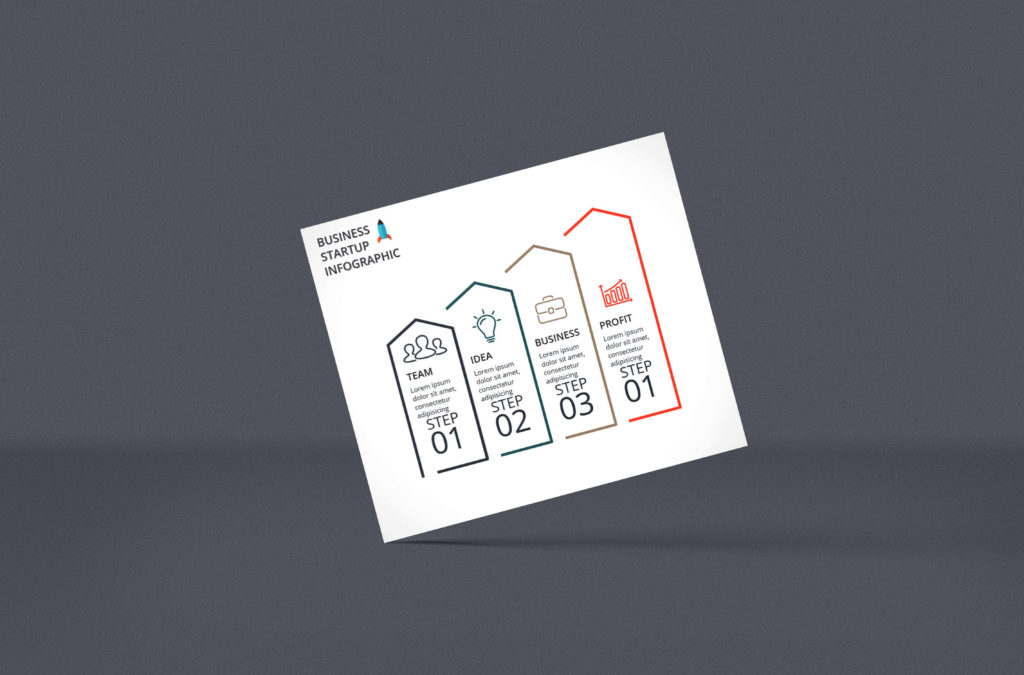
4 Step Infographics
As the name suggests, four-step infographics are designed to convey information using just four steps or stages. They are also used to simplify complex ideas or processes into a more easily understood format. 4 step infographics typically use arrows or other visual cues to indicate the flow from one step to another.

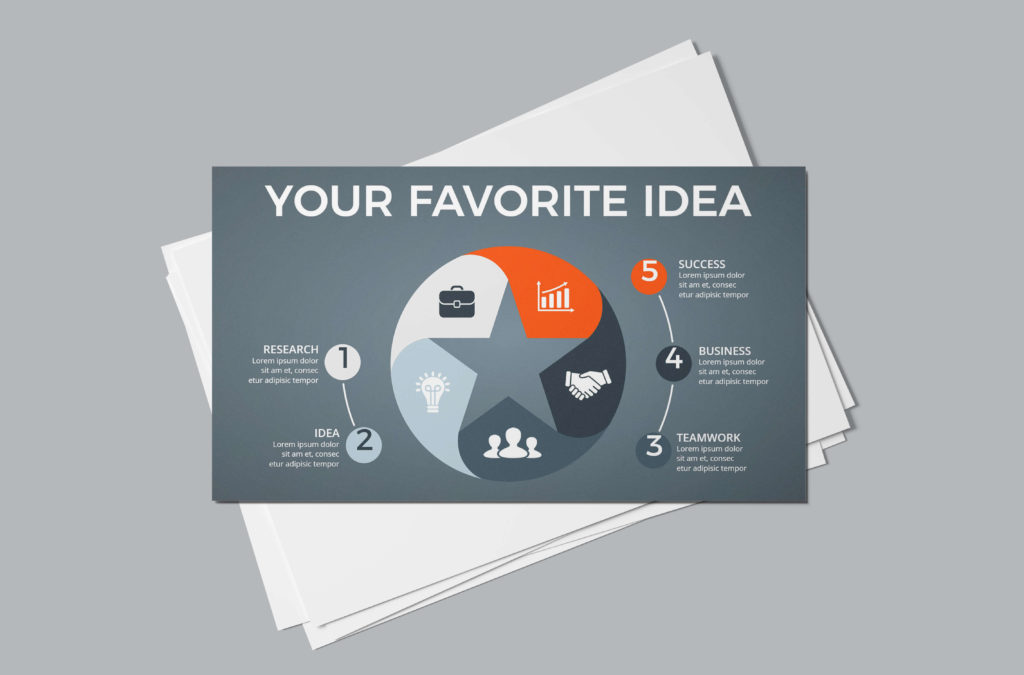
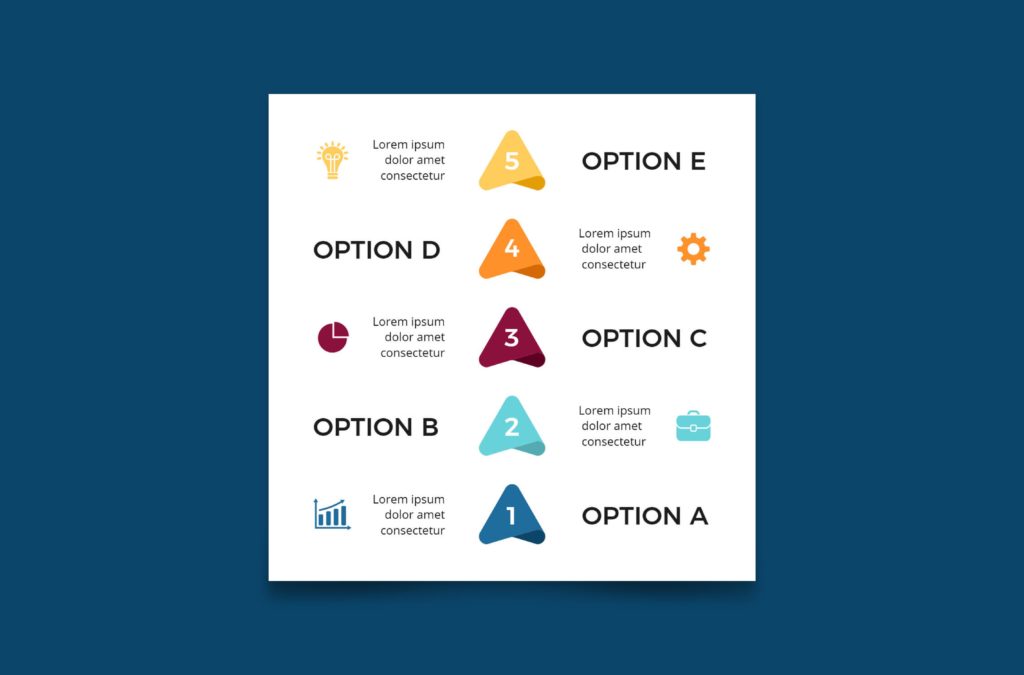
5 Step Infographics
If you’re looking to break down a process or explain a concept, a 5 step infographic may be the way to go. Additionally, these infographics present information in a clear and concise manner, usually with numbered steps and accompanying graphics.
5 step infographics are perfect for explaining anything from how to use a product to following a recipe, and they can help simplify complex ideas and make them more accessible.
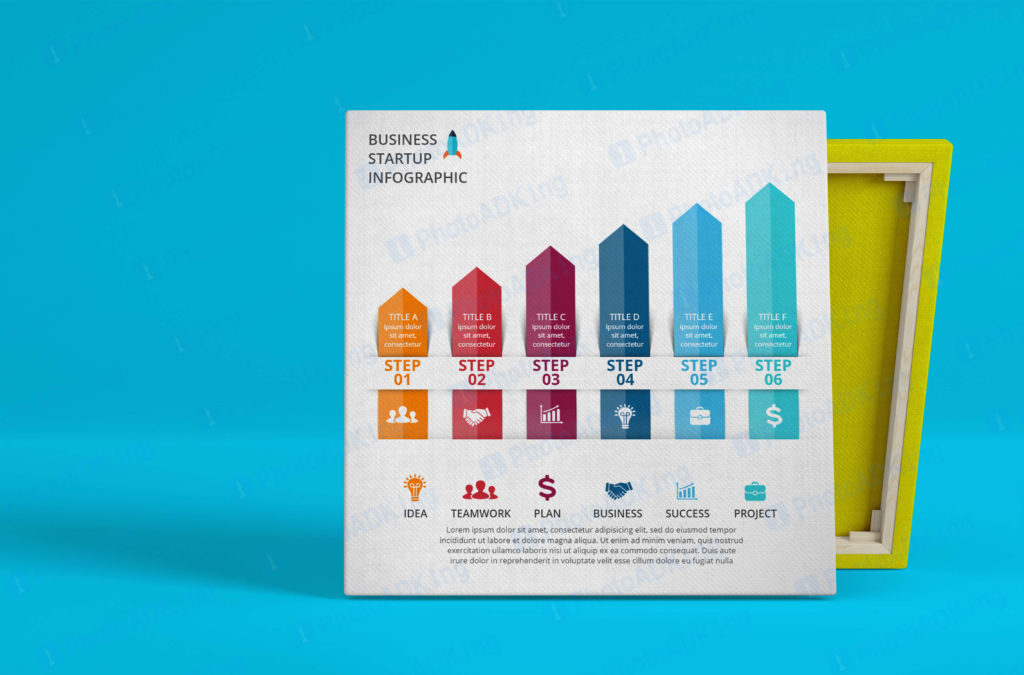
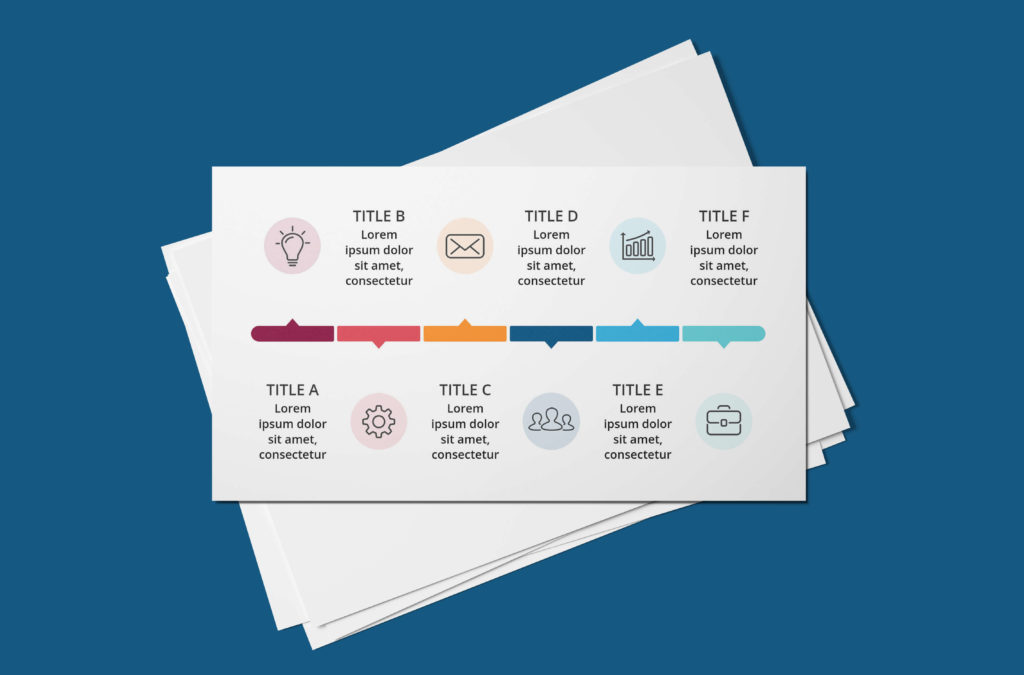
6 Step Infographics
6 step infographics are a type of infographic that breaks down a process or task into 6 steps. They are typically used to explain how to do something, such as how to cook a meal, how to set up a new piece of software, or how to fix a problem.
Moreover, 6-step infographics are easy to follow and can be very helpful for people who are new to a task or process.
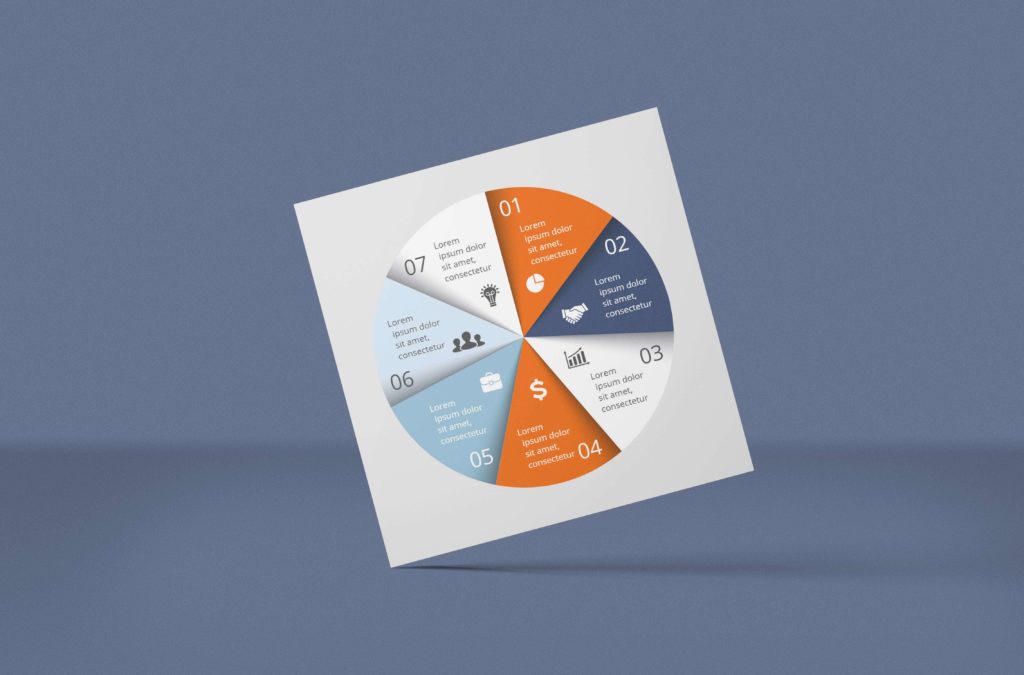
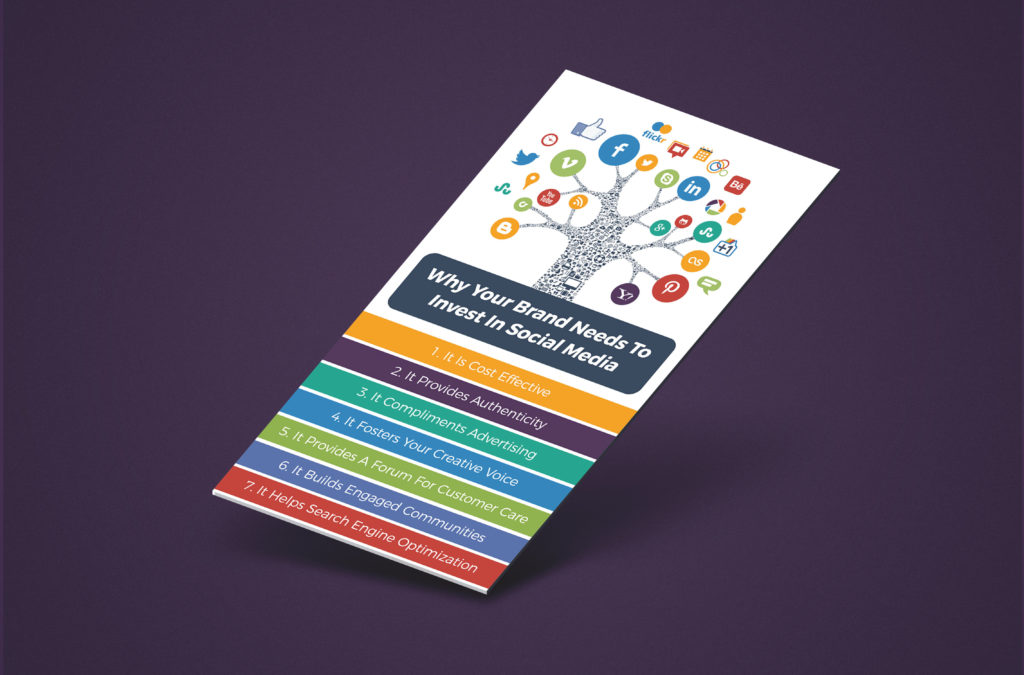
7 Step Infographics
7 step infographics are similar to 6 step infographics, but they break down a process or task into 7 steps. They are often used for more complex tasks or processes that require more explanation. Additionally, 7 step infographics can be very helpful for people who are trying to learn a new skill or understand a complex concept.
8 Step Infographics
8 step infographics are a popular type of infographic that is used to break down a complex process into 8 easy-to-follow steps. They are often used to explain how to do something, such as how to make a delicious meal, how to start a business, or how to get in shape.
When creating an 8-step infographic, it is important to make sure that the steps are clear and concise and that the infographic is visually appealing.
With these steps infographics, you can easily understand your topic to your targeted audience. But if you are in specific industries like food, health, marketing, social media education, etc., you must check the industry types of infographics below, which may help you more.
Industry Types of Infographics
When it comes to different industries businesses like charity, marketing, food, health, fashion, and education. You must consider the following industry-type infographics, as they can help your target audience get to know your business.
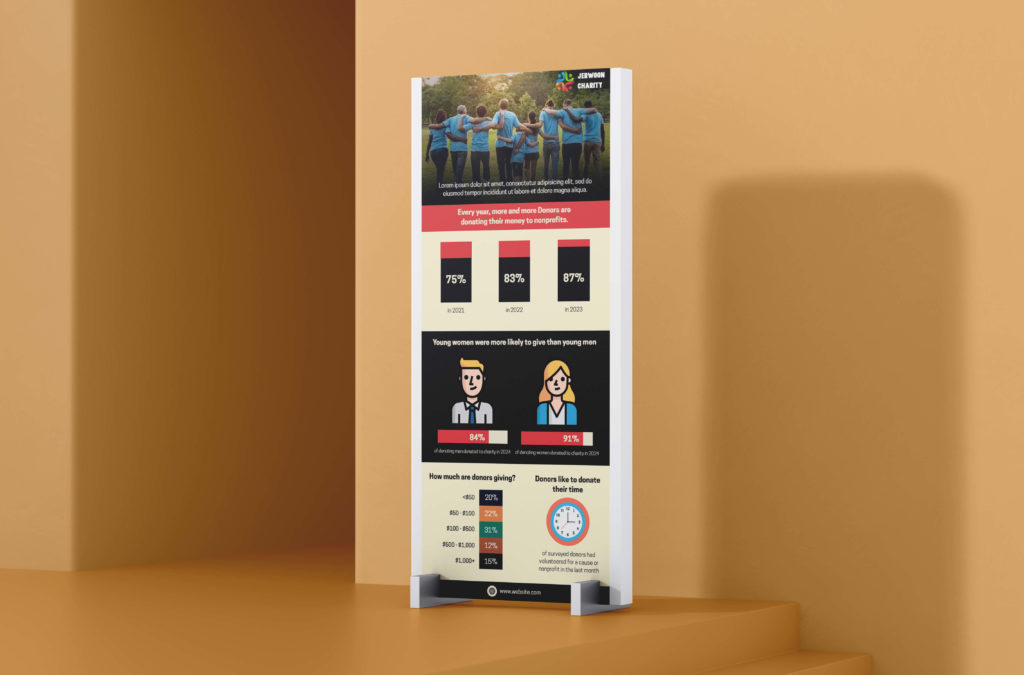
Charity Infographic
These infographics are designed to raise awareness about a specific cause or charity. They often include statistics and facts related to the cause, as well as compelling visuals that help bring the issue to life.
By using a charity infographic, you can share important information about your cause and inspire others to take action.
Business Infographics
Business infographics are designed for professionals who need to present data in a way that is easy to understand. These infographics typically feature charts, graphs, and other visual aids that help illustrate business concepts, such as sales figures, market trends, or customer demographics.
Moreover, you may want to include call-to-action elements in your infographic to encourage your audience to take action. Lastly, don’t forget to promote your infographic through social media and other relevant channels to maximize its reach.
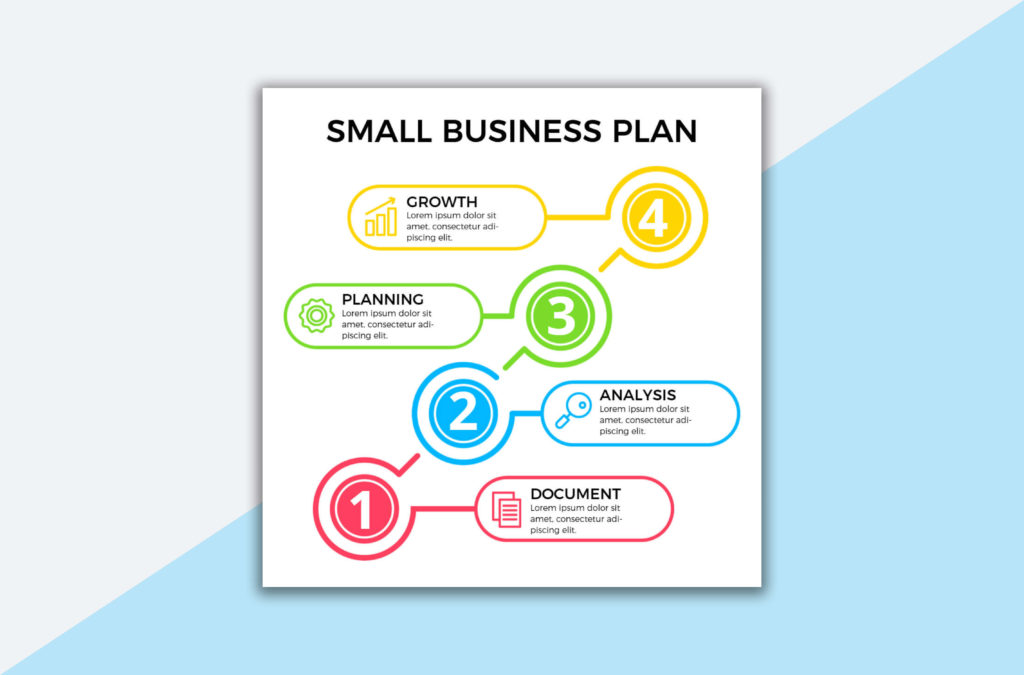
Business Plan Infographics
You can use this infographic to visually communicate your business plan to potential investors, partners, and employees. They can use to summarize your business model, financial projections, marketing strategy, and more.
When creating a business plan infographic, it is important to keep your audience in mind and to make sure that the information is easy to understand and visually appealing.
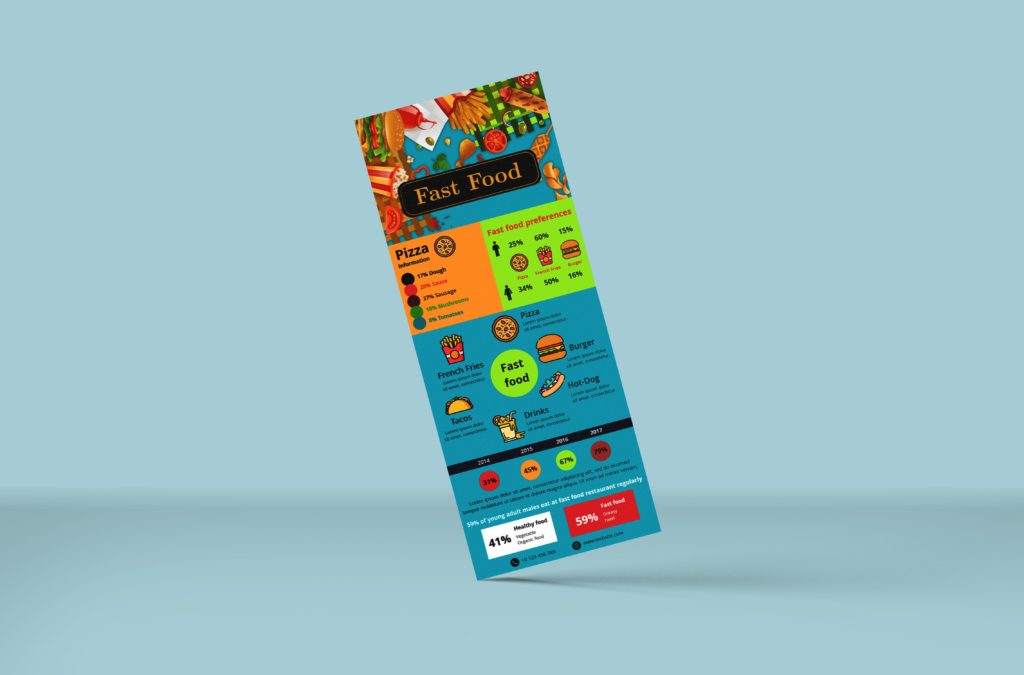
Food Infographics
Food infographics are a great way to share recipes, cooking tips, and food facts with your audience. They can also use to inspire people to cook at home, to learn about different cuisines, or to simply learn more about the food they eat.
When creating a food infographic, it is important to make sure that the information is accurate and that the infographic is visually appealing.
Project Management Infographics
Project management infographics are a type of infographic that is used to communicate information about a project. They can also use to track the progress of a project, communicate the goals of a project, or share information about the team working on a project.
Project management infographics can be a great way to keep everyone involved in a project on the same page and to ensure that the project stays on track.
Health Infographics
Health infographics are a type of infographic that is used to communicate information about health and wellness. They can use to educate people about health topics, promote healthy behaviors, or raise awareness about health issues.
Additionally, keep in mind that infographics are a visual medium, meaning that the design should complement the content. Furthermore, it’s crucial to use accurate data and reliable sources to ensure the credibility of your infographic.

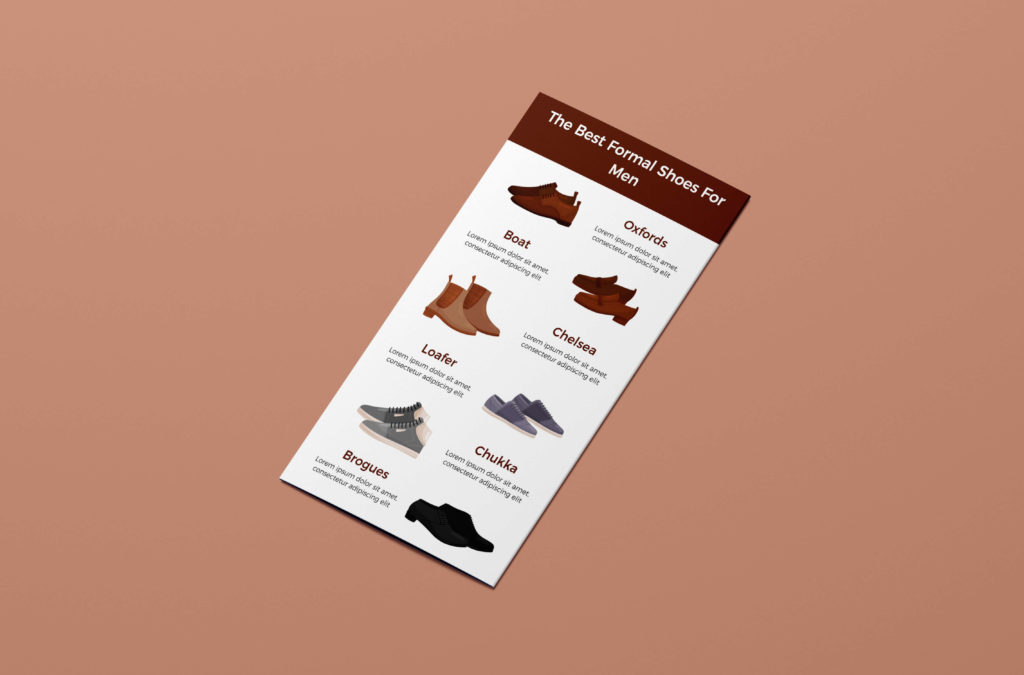
Fashion Infographics
Fashion Infographics are a stylish and engaging way to showcase the latest trends, fashion tips, and style advice. They combine eye-catching visuals with concise information, making them perfect for fashion enthusiasts and industry professionals alike.
Whether you want to create a guide on accessorizing for different occasions or highlight the evolution of fashion through the decades, Fashion Infographics allow you to convey your message effectively and memorably.
Social Media Infographics
With the rise of social media platforms, social media infographics have become a crucial tool for businesses and content creators. Additionally, social media infographics can serve as valuable resources for businesses to make data-driven decisions and adjust their social media strategies accordingly.
Social media infographics can cover topics such as user demographics, engagement rates, or platform usage. They also help to showcase key performance indicators (KPIs) and demonstrate the impact of social media marketing campaigns.
Education Infographics
Education Infographics design to communicate complex concepts or information in a visually engaging way. These infographics are often used in classrooms to aid learning or in textbooks to illustrate concepts.
Additionally, education infographics can include timelines, flowcharts, diagrams, and maps. Furthermore, social media infographics have also become increasingly popular in the field of education.
Marketing Infographics
Marketing infographics serve as a powerful tool for promoting a product, service, or brand. Moreover, marketing infographics often feature bold colors, eye-catching graphics, and clear messaging to grab the attention of potential customers and hold their interest.
As a result, these visual aids can be highly effective in driving engagement and generating leads.
Alright, so now your confusion is clear about which types of infographic you should choose. Hope this blog is helpful, and if you want to know each and everything about infographics, then check out our blog here.
Other Infographic Blogs
- How To Make an Infographic
- Infographic Examples
- Infographic Size
- Ways Infographics Can Help Improve Brands Visibility
- Infographic Layout Ideas
How to Choose the Right Infographics
Consider your audience: What are their interests? What level of knowledge do they have about the topic? You want to choose infographics that will be interesting and informative for your audience.
Think about your goals: What do you want to achieve with your infographic? Do you want to educate your audience? Persuade them to take action? Or simply entertain them? Choosing the right infographics will help you achieve your goals.
Choose the right type of infographic: There are many different types of infographics, each with its own strengths and weaknesses. Some popular types of infographics include:
- Statistical infographics
- List infographics
- Process infographics
- Comparison infographics
Find high-quality infographics: There are many great infographics available online. But there are also a lot of low-quality infographics out there. To find high-quality infographics, look for those that are well-designed, informative, and engaging.
Use infographics effectively: Once you’ve chosen the right infographics, use them effectively. Make sure to include them in your marketing materials, blog posts, and other content. Moreover, infographics can be a great way to attract attention, educate your audience, and drive traffic to your website.
When it comes to infographic design, then you should also consider below design tips.
Here are some additional tips for creating infographics:
- Use clear and concise language.
- Use high-quality images and graphics.
- Make sure your infographic is easy to read and understand.
- Use a consistent design throughout your infographic.
- Test your infographic with a small group of people before you share it with a wider audience.
By following these tips, you can create different types of infographics that are informative, engaging, and visually appealing.
Conclusion
infographics are a powerful tool for presenting information in a visually compelling way. They can be also used to showcase statistics, explain complex concepts, or tell a story. There are several types of infographics to choose from, such as including statistical, timeline, process, geographic, comparison, and hierarchical.
Each type has its own unique strengths and can be customized to suit the needs of your audience and message. Hope this guide will help you to choose and create an infographic.
You can also use pre-designed infographic templates to simplify the process of creating amazing infographics. Whether you’re looking to present data, explain a process, or tell a story, infographics can help you do so in a clear and engaging way.
Try Pre-designed Infographic Templates from PhotoADKing
Choose an infographic template from a wide range of collections and customize it with ease.
Try Infographic TemplatesFAQs
What type is best for infographics?
When it comes to infographics, the best type depends on the data being represented and the overall design of the infographic. However, some types of infographics tend to be more effective in conveying certain types of information. For example, if the goal is to show a timeline or a process, a chronological or flowchart style may be most appropriate.
Why do you have to know which type of infographic is perfect for your business?
There are a few reasons why you need to know which type of infographic is perfect for your business. First, different types of infographics are better suited for different purposes. For example, if you’re trying to illustrate a trend, a statistical infographic would be a good choice. If you’re trying to explain a process, a process infographic would be a better choice.
How can you use statistical infographics for your business?
Statistical infographics can be a great way to illustrate trends, compare products or services, or simply provide information in a visually appealing way. For example, you could use a statistical infographic to show how your sales have increased over the past year or to compare the features of your product to the features of your competitors’ products.
How can you use the process infographic to explain your next strategies?
Process infographics can be a great way to explain a complex process or workflow in a clear and concise way. An example of utilizing infographics is creating a process diagram to illustrate the production of a newly launched product. This visual aid can also showcase how customers could use the product to achieve their desired goals.