You know infographics when you see them. They’re the graphics that use data and images to tell a story or make a point in a visually interesting way. And while you may think it’s challenging to create an infographic, that’s not always the case. In fact, there are lots of creative infographic examples out there just waiting to be executed.
5000+ Predesigned Infographic Templates from PhotoADKing
Choose a infographic template from a wide range of collections and customize it with ease.
Choose Infographic Templates!We’ve collected some of the best infographic examples and ideas to help get your creative juices flowing. So whether you’re looking for inspiration or just starting out, we’ve got you covered. So let’s dive in!
What is an Infographic?
An infographic is a visual representation of information or data designed to present complex concepts or data sets clearly and concisely. It combines elements such as text, images, charts, and graphs to communicate information quickly and effectively. Infographics are used across various fields, including journalism, marketing, education, and research, to present data-driven stories, statistics, or explanations.
Infographic Examples and Ideas
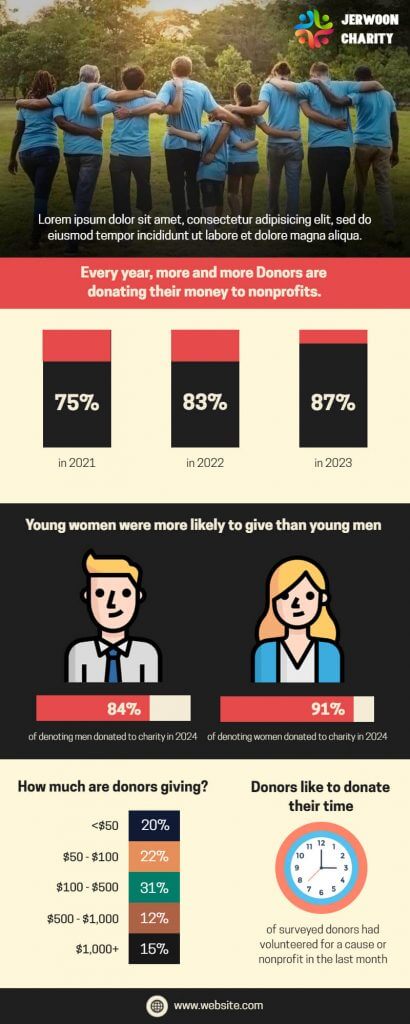
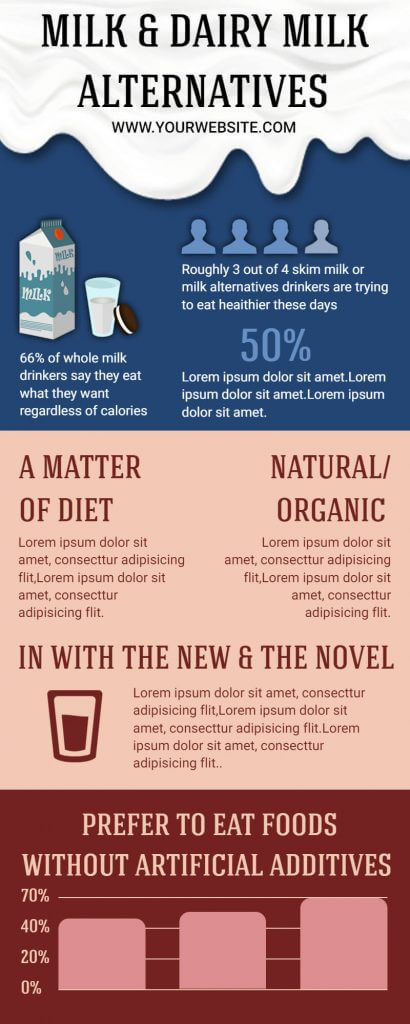
Statistical Infographics
Timeline Infographics
Process Infographics
Comparison Infographics
Geographic Infographics
Hierarchical Infographics
List Infographics
Mind Map Infographics
Social Media Infographics
Flowchart Infographics
Pie Chart Infographics
Business Plan Infographic
Marketing Infographic
Agenda Infographic
Fashion Infographic
Explore various ways to create cool pictures that explain things, including the best examples of infographic design. Learn how to turn complicated information into easy-to-understand images through interactive infographic designs. This collection showcases creative ideas for making your own awesome infographics, demonstrating the infographic samples. Discover how pictures can tell interesting stories and share information in a fun and exciting way!
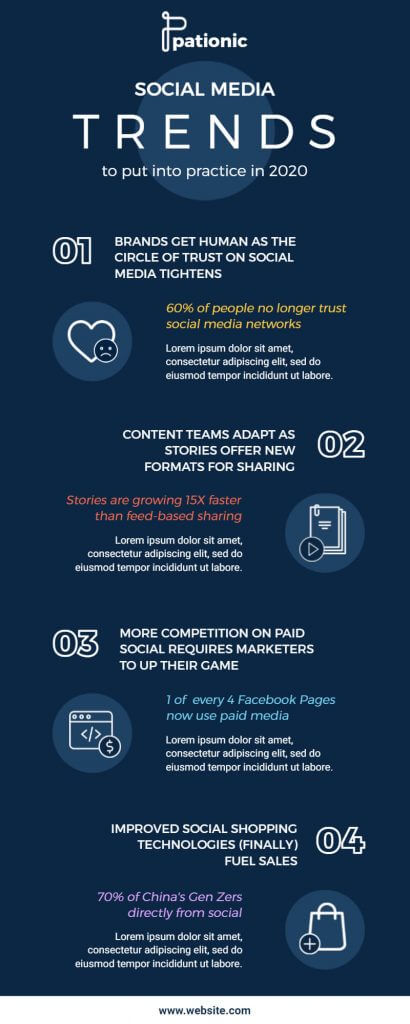
Statistical Infographics
These are infographics that use such as numbers, graphs, and charts to represent data and statistics.
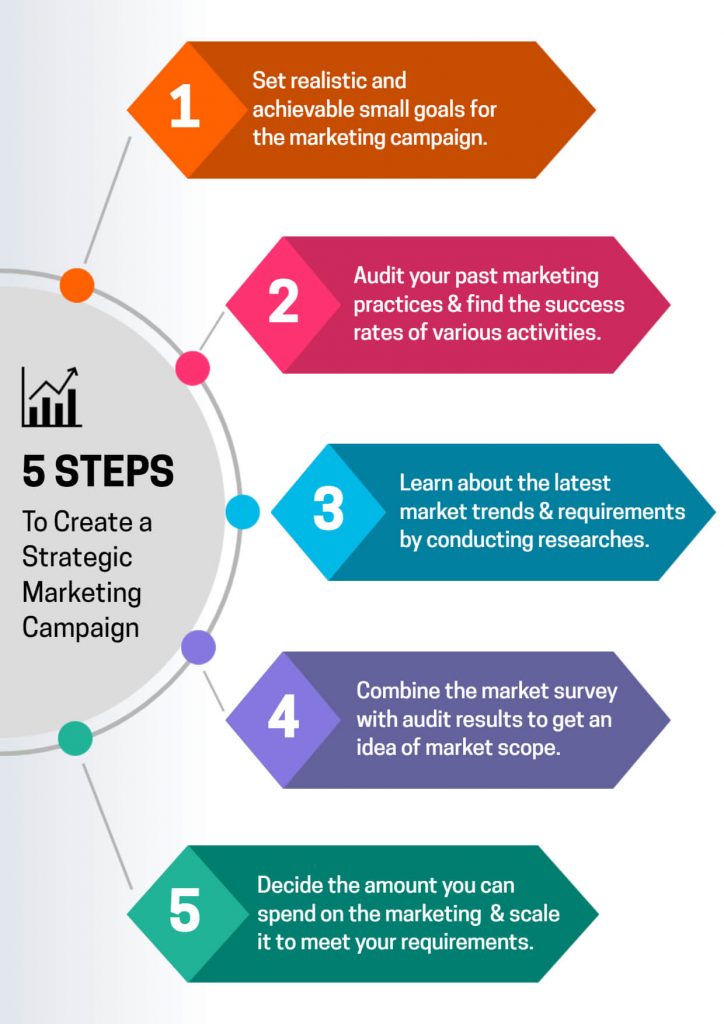
Timeline Infographics
These are infographics that show the chronological order of events or a sequence of steps. so that helps to understand the complete step easily.
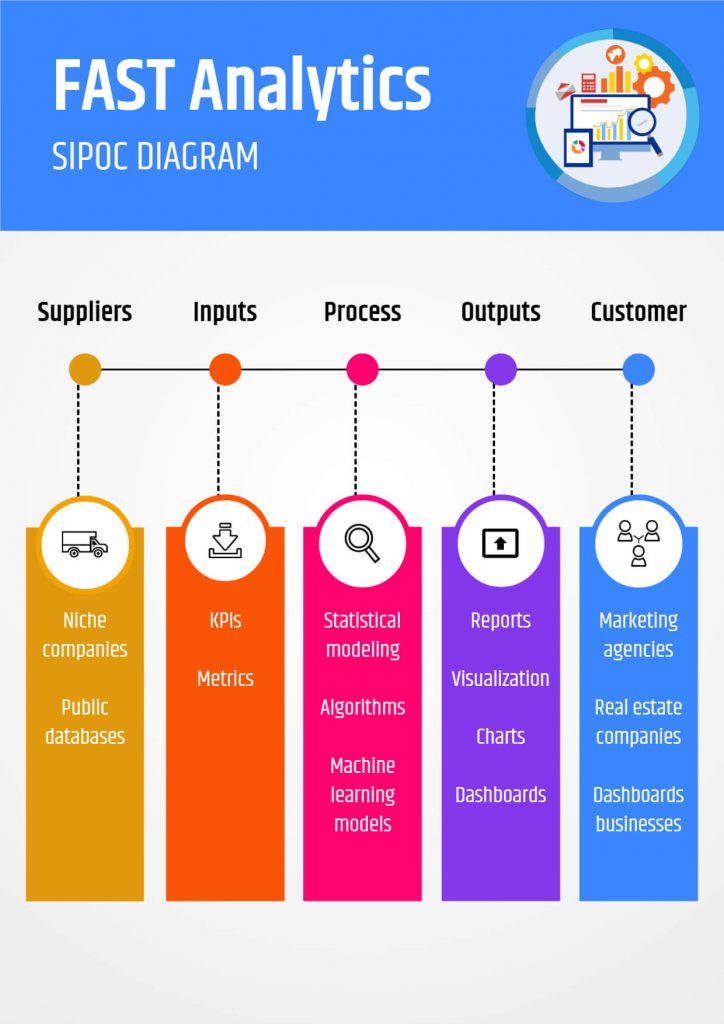
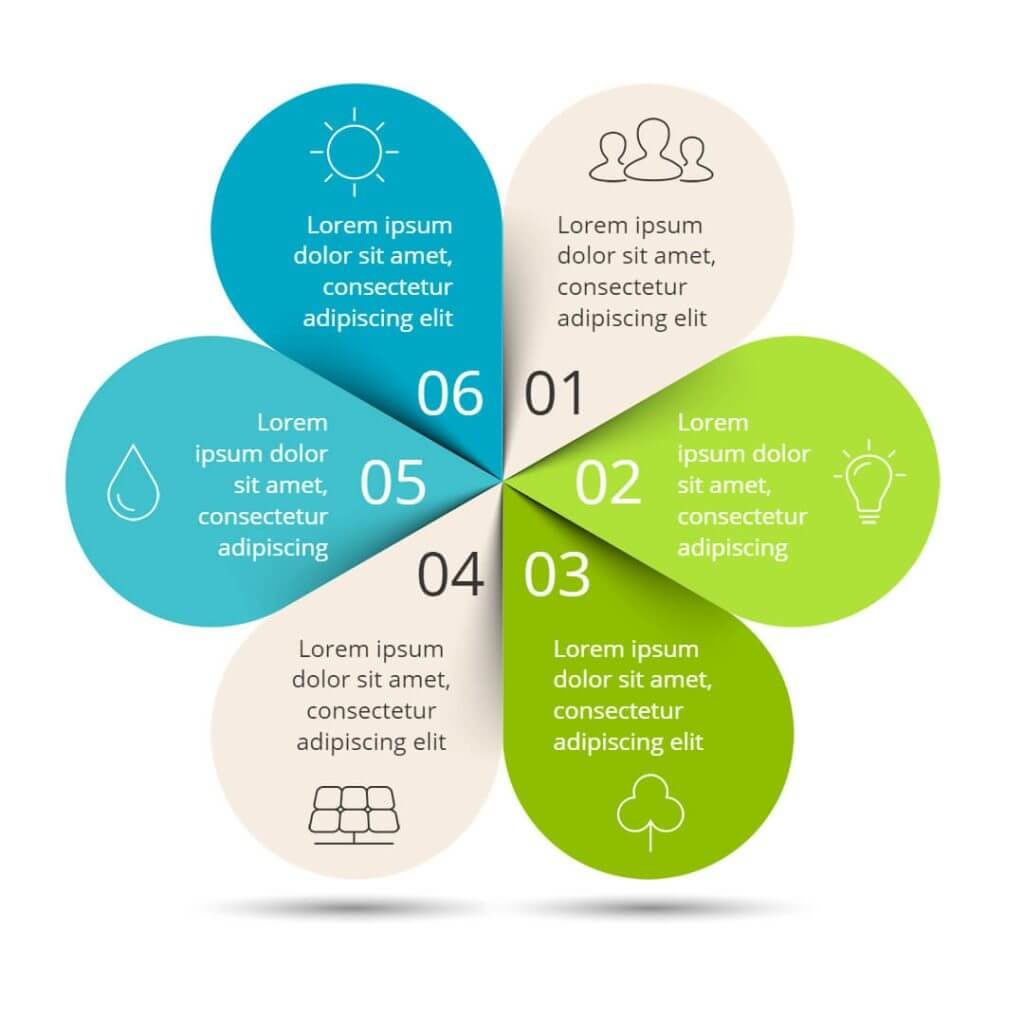
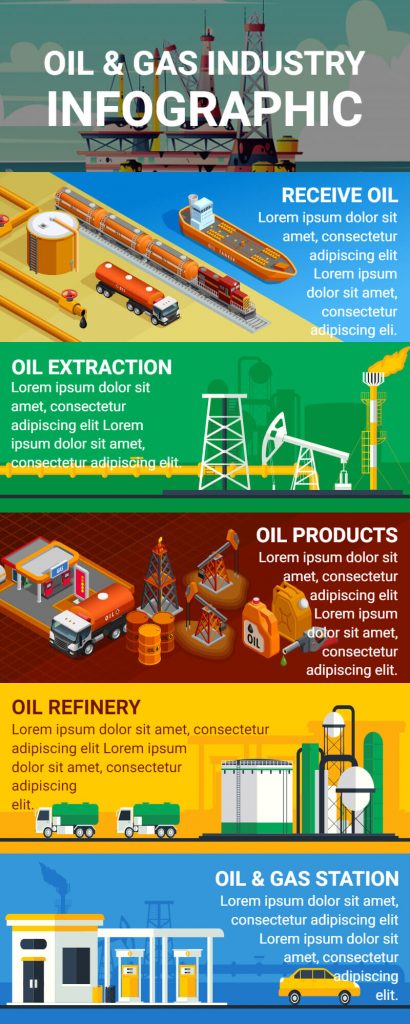
Process Infographics
These are infographics that visually explain a process or system, often using flowcharts or diagrams, perfect for data storytelling.
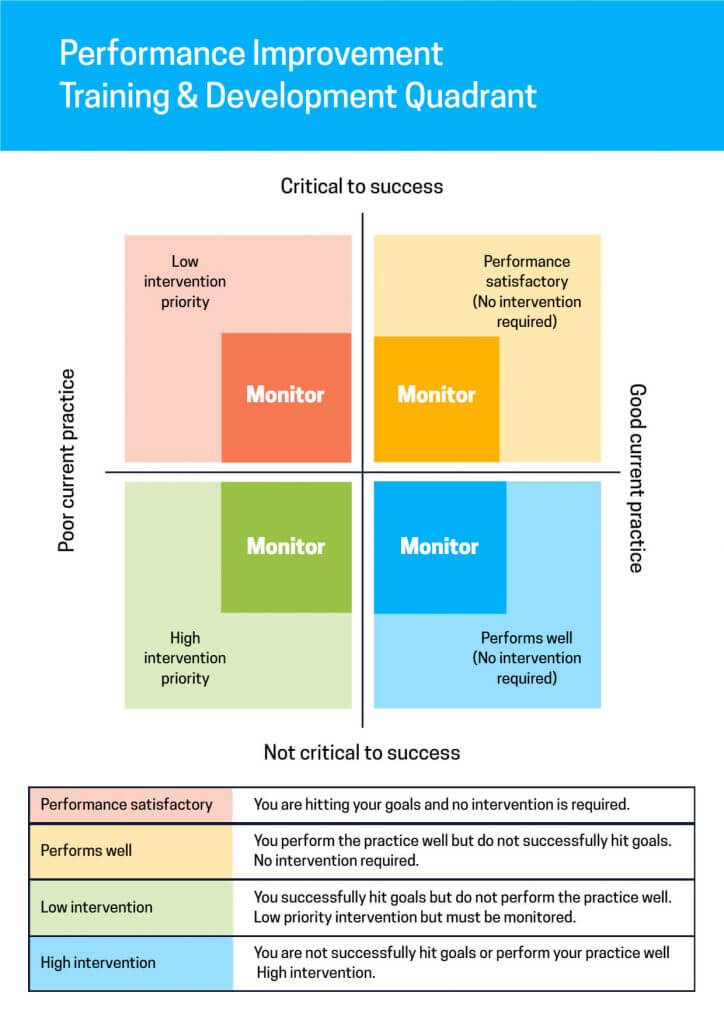
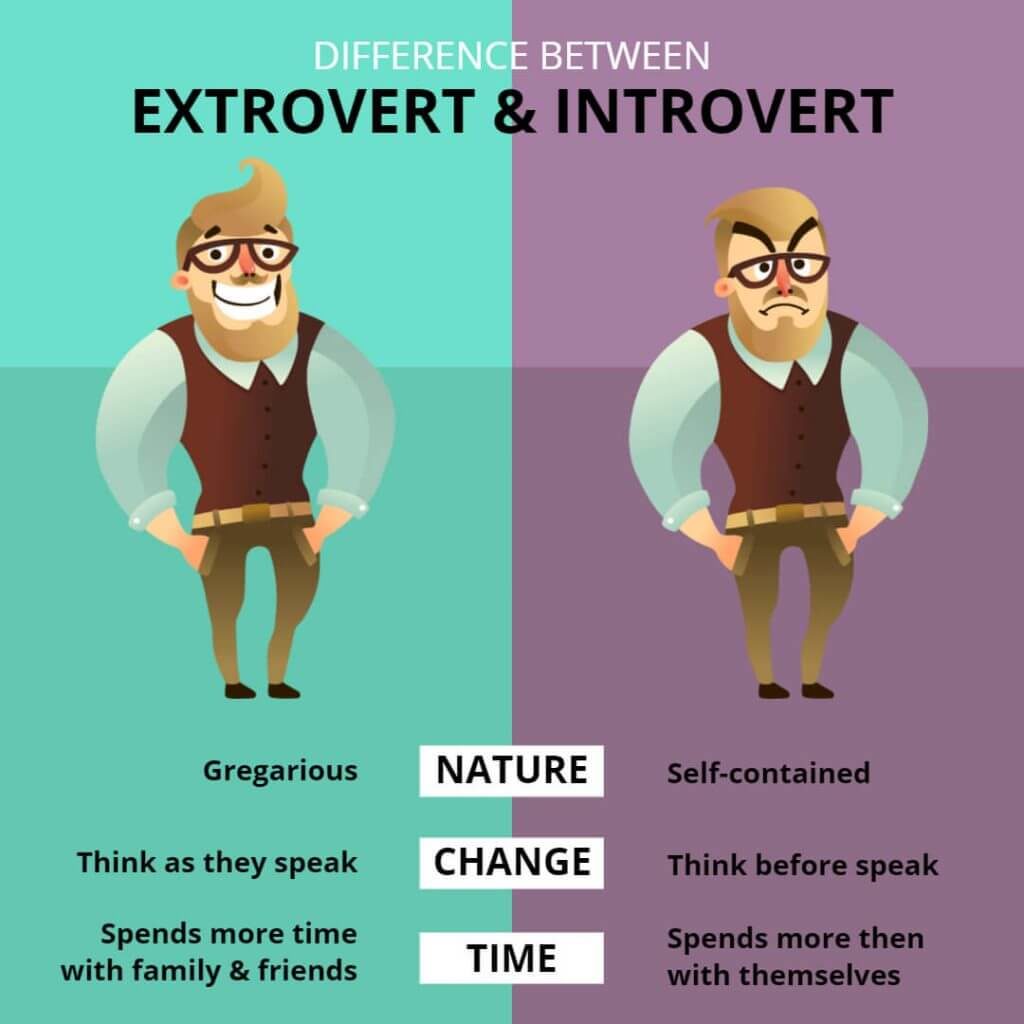
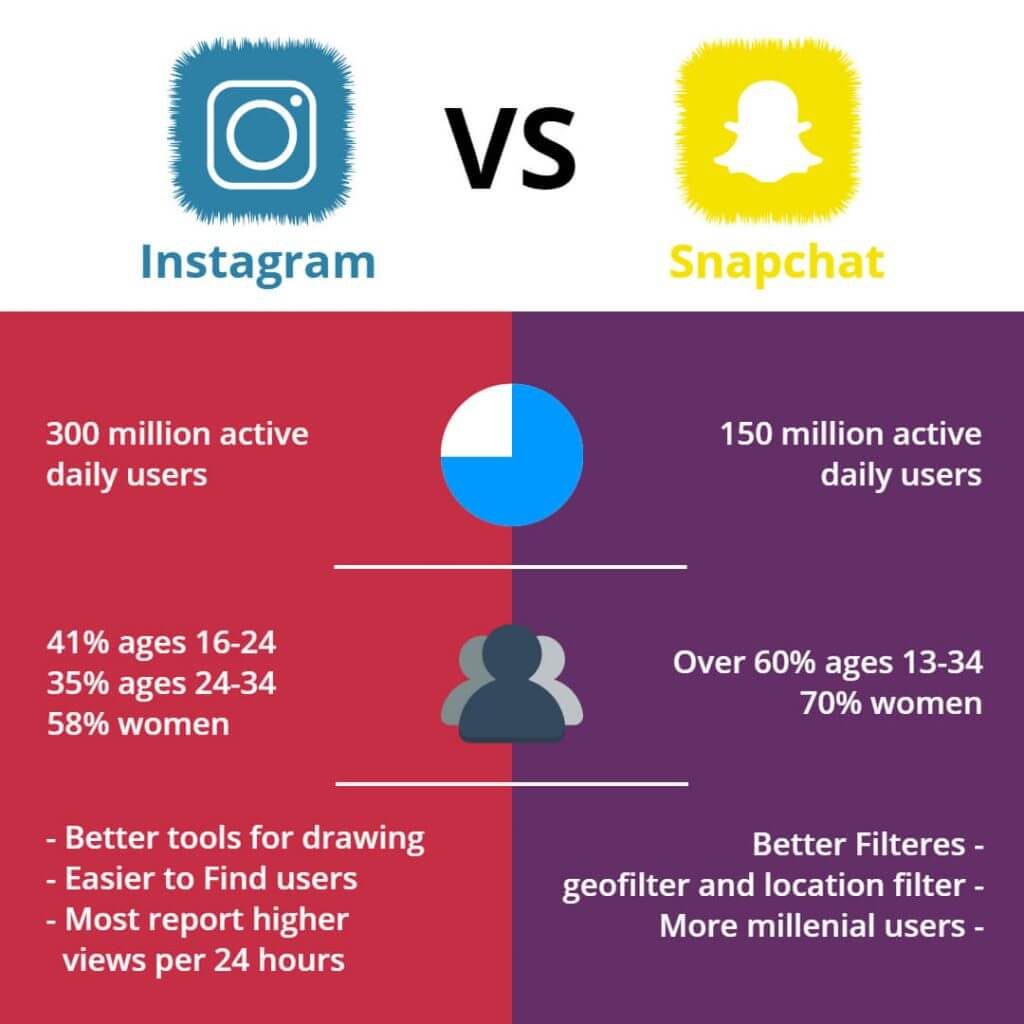
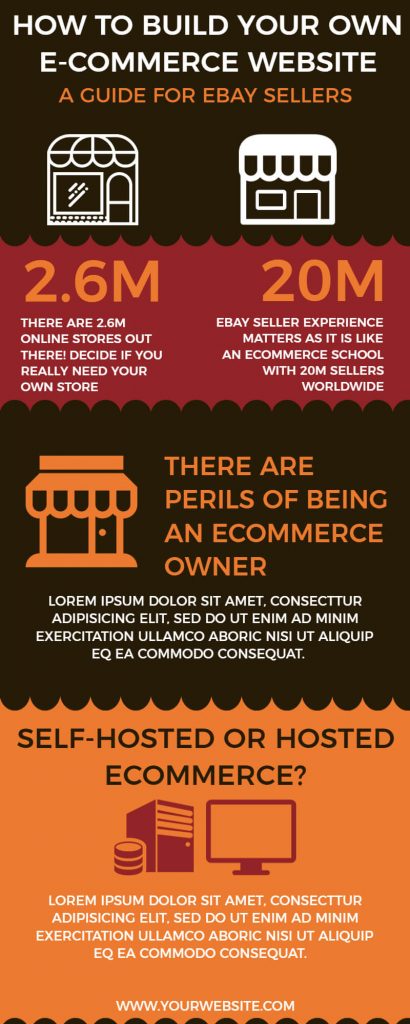
Comparison Infographics
These are infographics that compare and contrast two or more things, such as products or services.
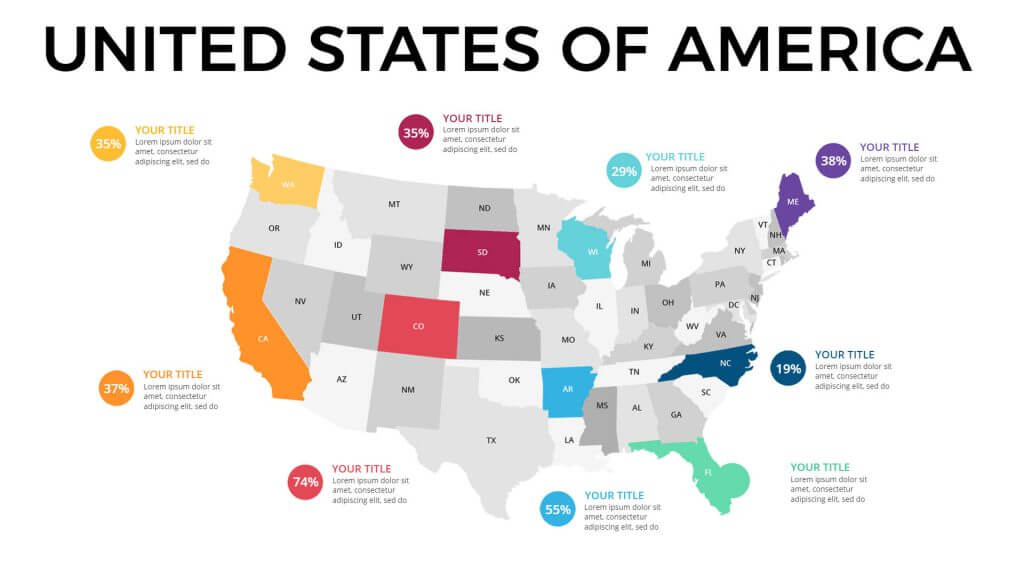
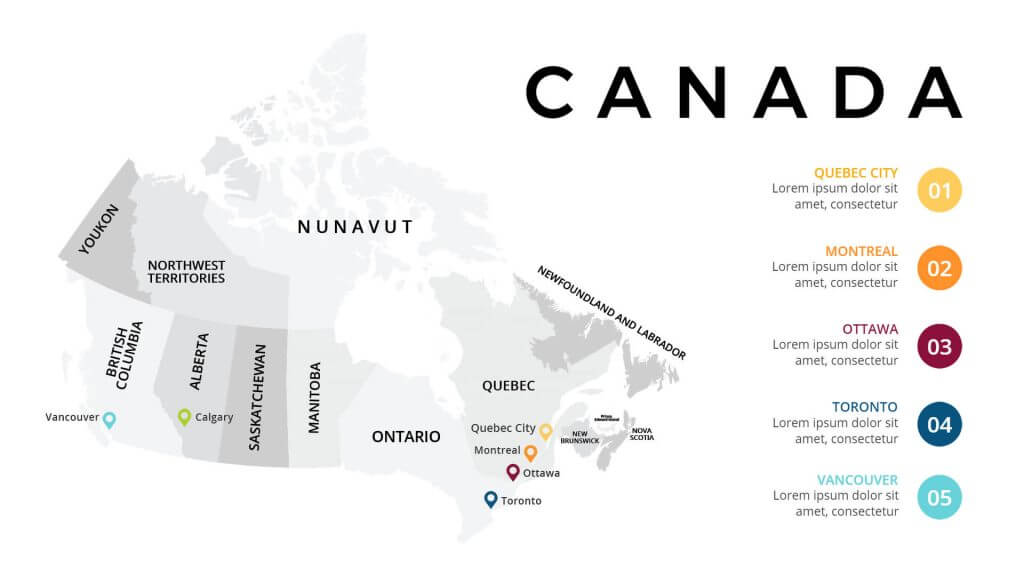
Geographic Infographics
These are infographics that use maps or other geographic representations to convey information.
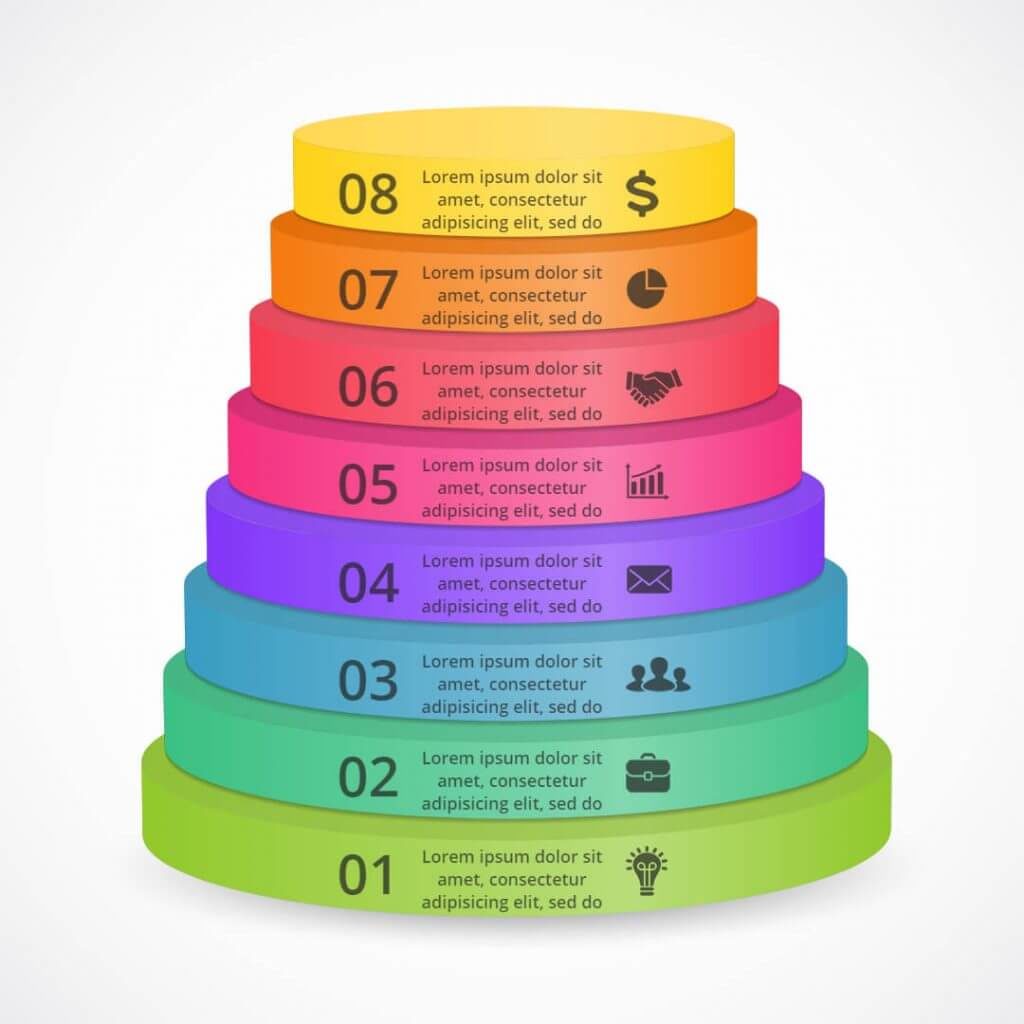
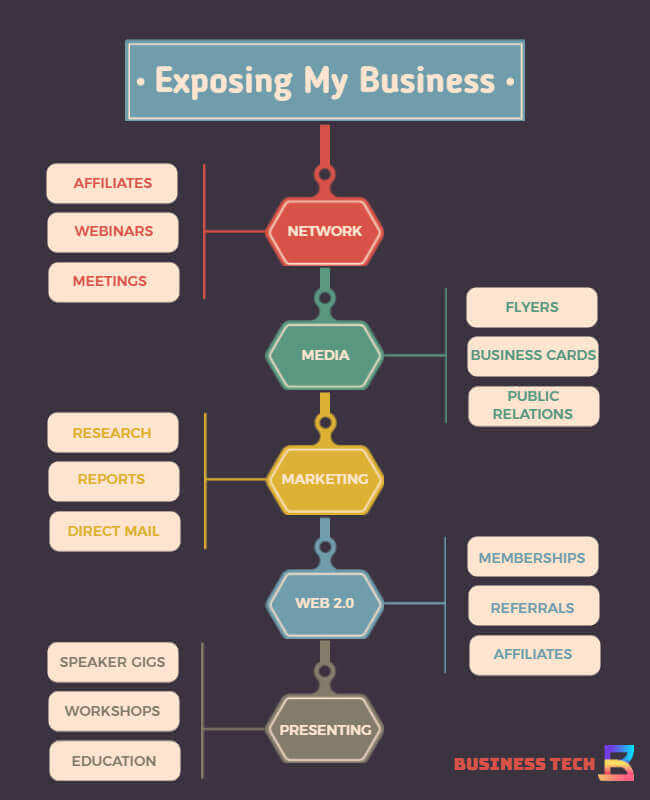
Hierarchical Infographics
These are infographics that visually represent a hierarchy or organizational structure, so they often use tree diagrams or other similar structures.
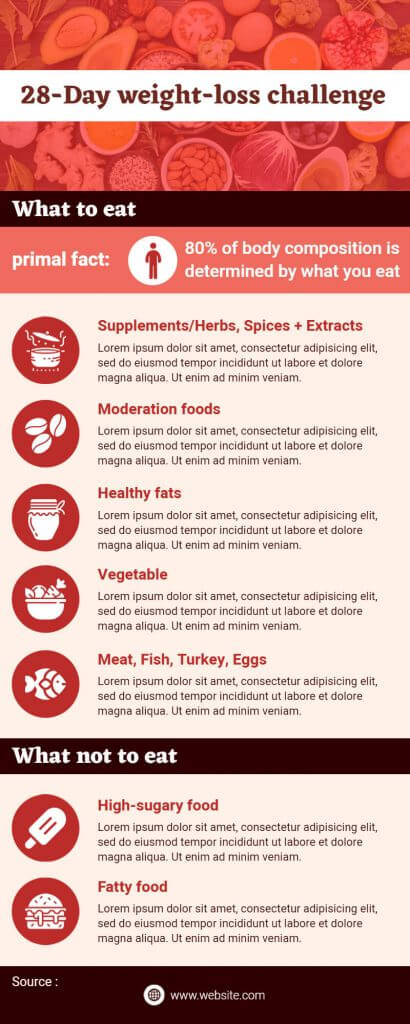
List Infographics
These are infographics that present information in a list format, often using bullet points or other visual cues because they make the information more easily digestible.
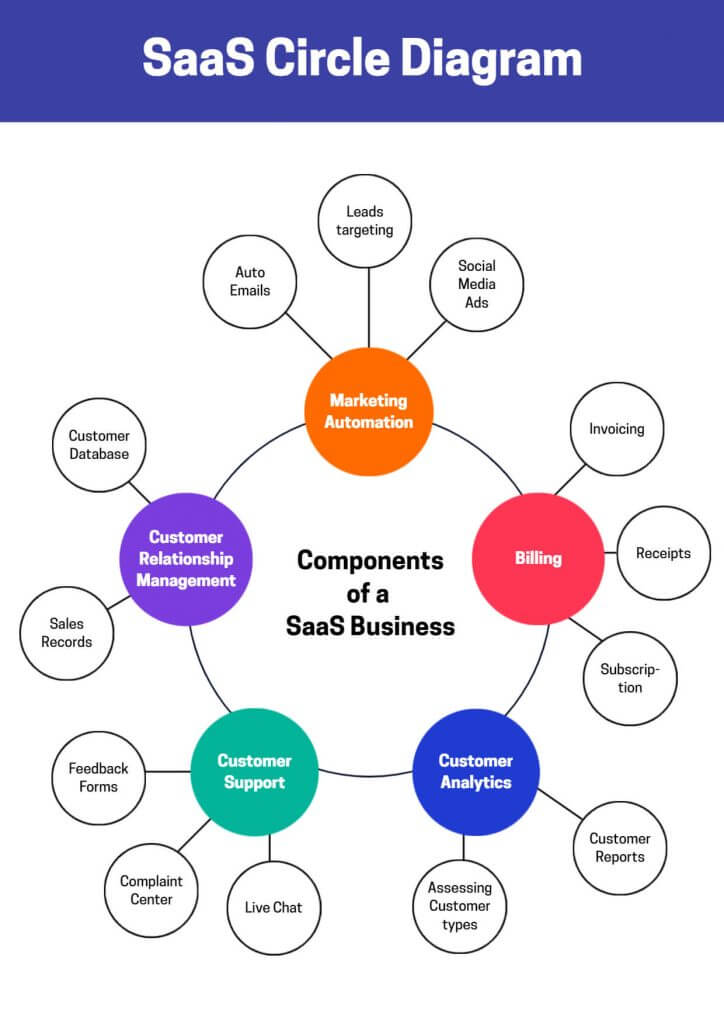
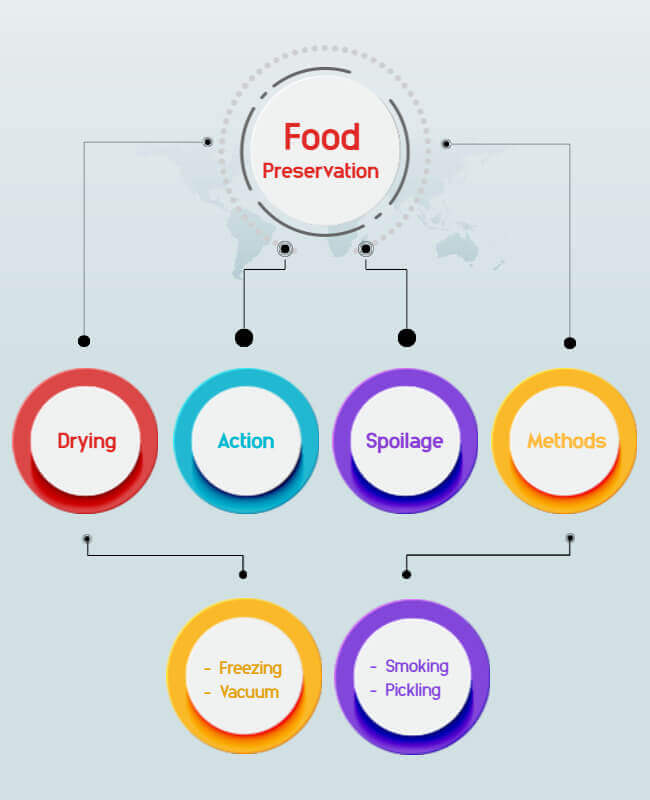
Mind Map Infographics
These are infographics that visually represent a brainstorming or thought process, often using a central idea or concept such as the starting point, and branching out into related ideas or topics.
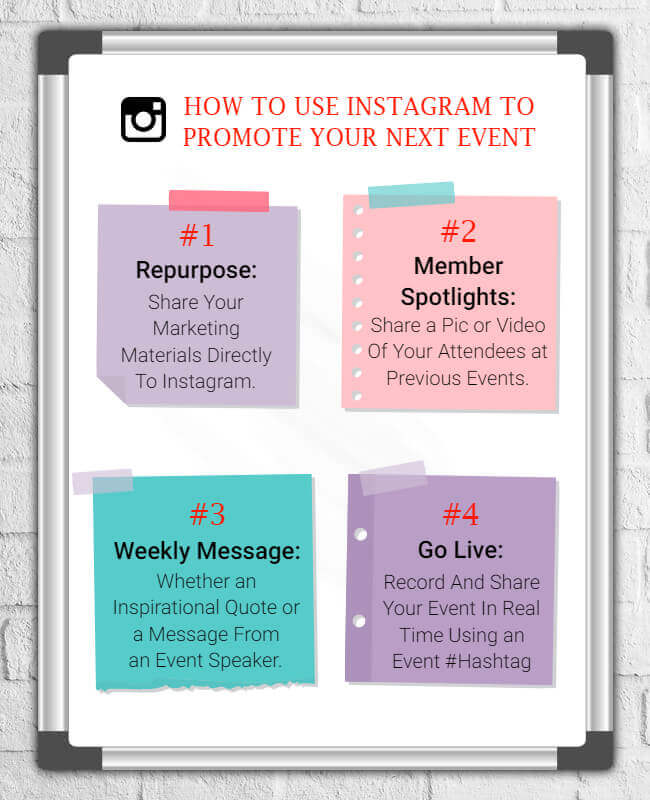
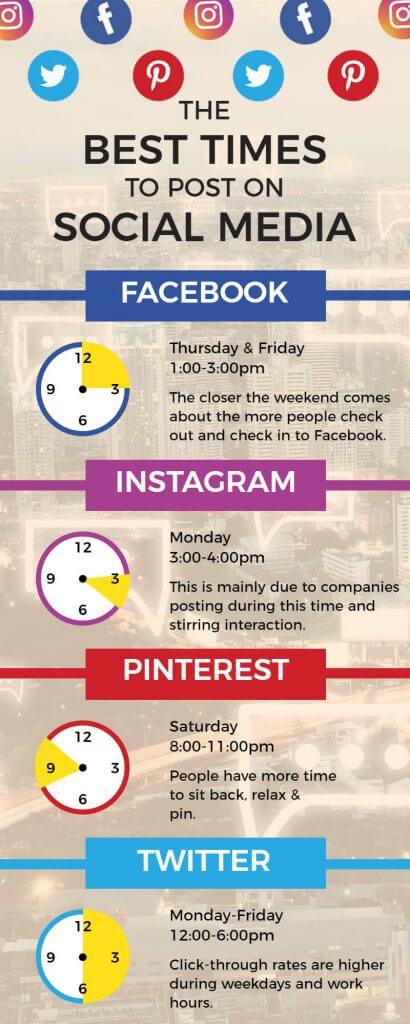
Social Media Infographics
These are infographics that are specifically designed to be shared on social media platforms, often using eye-catching visuals and concise messaging to capture the attention of users.
Flowchart Infographics
These are infographics that visually represent a decision-making process or workflow, often using arrows and boxes to show the sequence of steps because they help to provide complex data in an easy way.
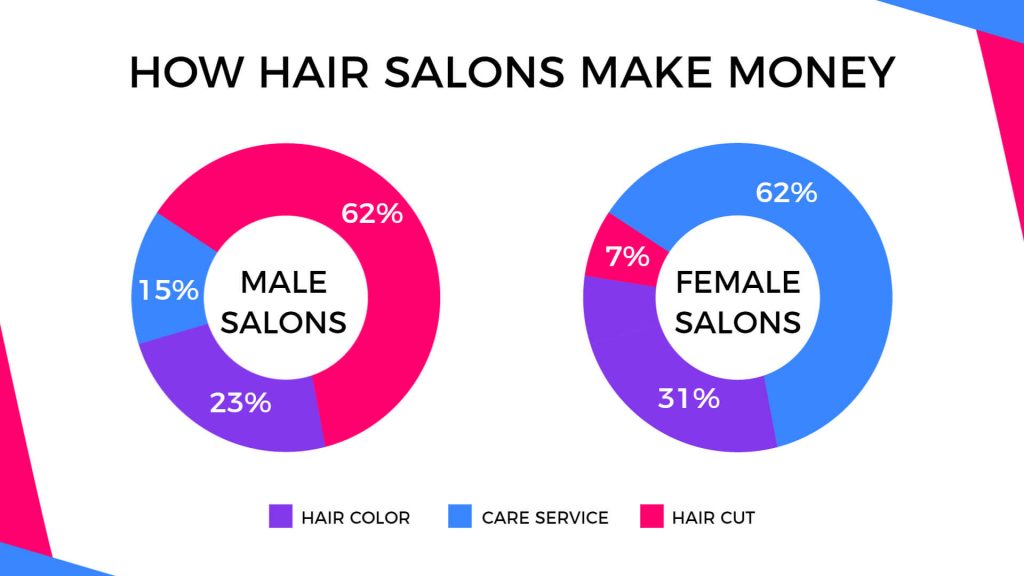
Pie Chart Infographics
These are infographics that represent data using pie charts, with each slice representing a different percentage or proportion. So, with the help of a pie chart you can represent big data in a simple way.
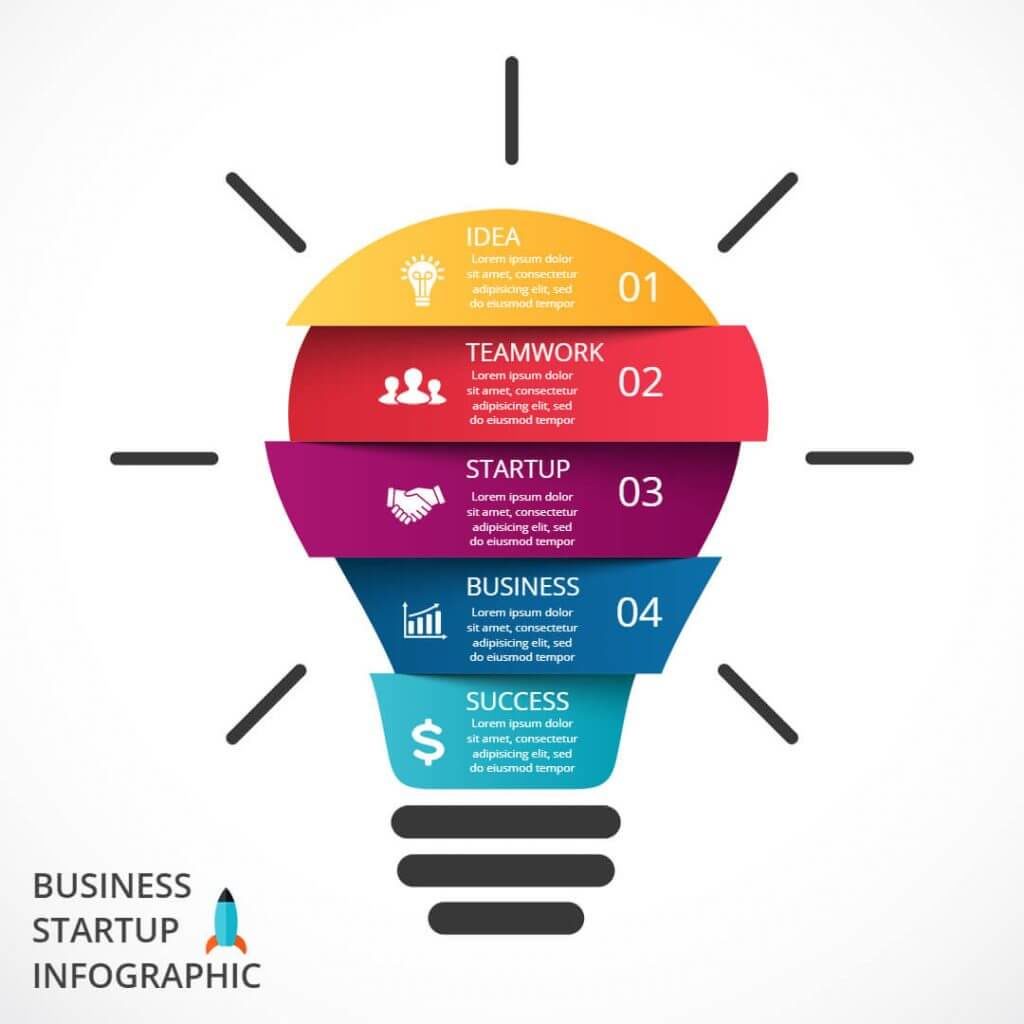
Business Plan Infographic
A business plan infographic is a visual representation of the key components of a business plan. It typically includes information such as the company’s mission statement, target market, product or service offerings, marketing strategy, financial projections, and goals for growth. Additionally, the infographic may use icons, charts, and graphs to help illustrate the information in a clear and concise manner.
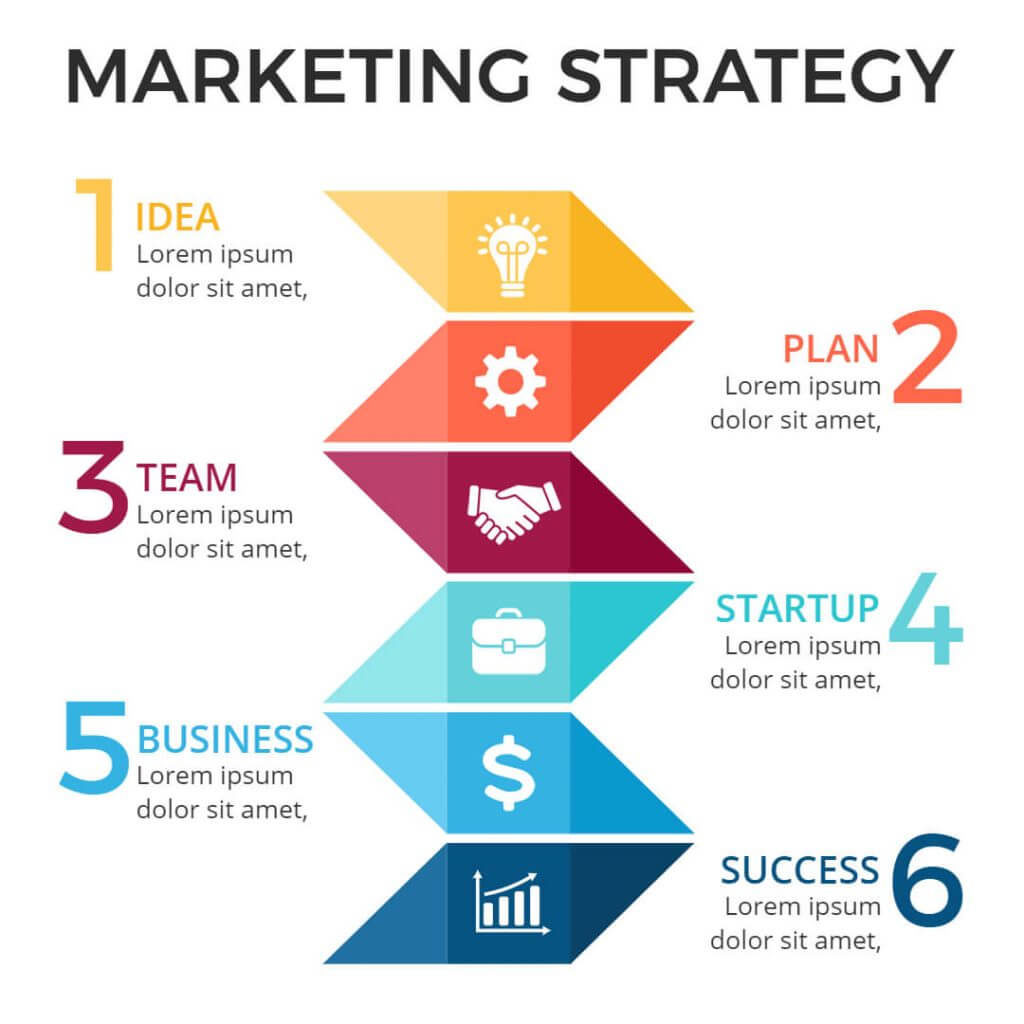
Marketing Infographic
A marketing infographic is a visual tool that can be used to convey important information about a company’s marketing strategy. This may include data on the target market, advertising channels, pricing strategy, and promotion tactics. Marketing infographics can be particularly effective at capturing the attention of potential customers and communicating key messages in a memorable way.
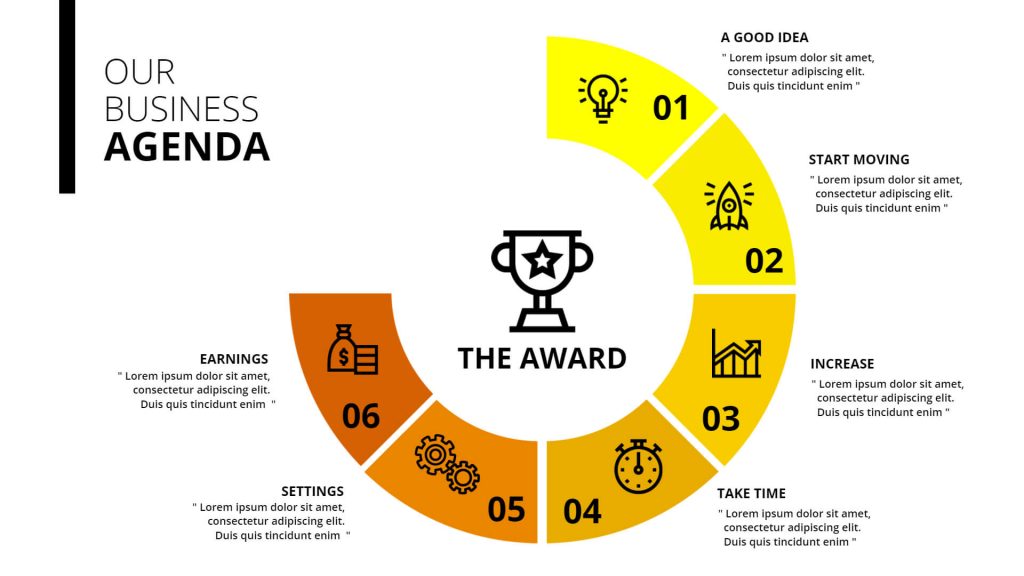
Agenda Infographic
An agenda infographic is a visual representation of the schedule and topics to cover in a meeting or event. It can be useful for organizing thoughts, communicating expectations, and ensuring that all participants are on the same page. The infographic sample may include headings, subheadings, and icons to help distinguish between different topics and keep the information organized.
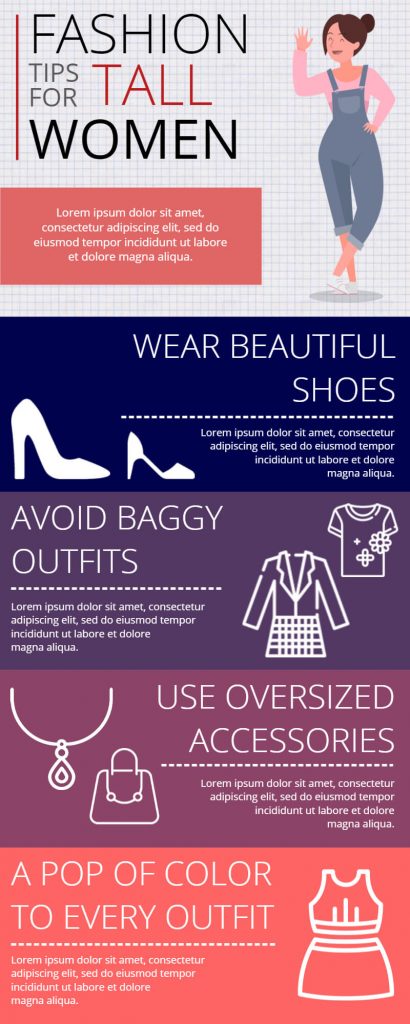
Fashion Infographic
A fashion infographic is a visual tool that can be used to convey information such as the latest trends, styles, and fashions in the industry. It may include data on consumer preferences, seasonal trends, color palettes, and popular designers. Fashion infographics can be particularly useful for retailers and designers who want to stay up-to-date on the latest trends and preferences in the industry.
But you may be amazed to know the benefits of infographics.
Infographics offer several benefits, including:
- Simplified communication: Infographics condense complex information into easily understandable visuals, making it simpler for viewers to grasp the main points at a glance.
- Visual appeal: The combination of visuals, colors, and typography in infographics enhances their visual appeal, making them engaging and memorable for the audience.
- Data visualization: Infographics transform raw data into meaningful visuals, such as charts, graphs, and diagrams, allowing viewers to comprehend patterns, trends, and relationships within the data.
- Increased retention: Due to their visual nature, infographics can enhance information retention and recall. The human brain processes visuals more efficiently, making the content more memorable compared to plain text.
- Increased shareability: Infographics are highly shareable on social media platforms, websites, and blogs. Their visually appealing and concise format makes them more likely to be shared, increasing their reach and potential impact.
Here are some data points that highlight the popularity and effectiveness of infographics:
- According to a study by the Social Science Research Network, 65% of people are visual learners, indicating a preference for visual content like infographics.
- HubSpot, a marketing software company, reported that blog posts with infographics receive 30 times more shares than those without.
- According to a study published in the Journal of Business Communication, incorporating infographics in presentations increases audience engagement by 40%.
- The global market for infographics is projected to reach $1.6 billion by 2026, according to a report by Global Market Insights.
Overall, infographics are a powerful tool for presenting information in a visually appealing and digestible format, making complex data more accessible to a wide range of audiences.
Conclusion
So there you have some of the best infographic examples to get you started. Infographics can be really fun and inspiring to work on, and they can help you communicate complex information in a clear and concise way. So you just have to remember to keep it simple and choose a topic that you’re interested in. Also, it’s easier for you to make infographics online by simply using an infographic maker that provides everything you need. If you want to create infographics from your iPhone, then download the Infographic Maker App now. So, let’s get started!
Discover Best Infographic Templates for Your Business.
Make eye-catching infographics using PhotoADKing’s infographic maker. Increase interaction and wow your audience.
Create Your Own Infographics!